Markov Chains in Marketing Attribution
1. The Hook
I was back in Ujvi Candles' office, and the honeymoon phase with "Linear Attribution" was over. We had just shown the CEO the new dashboard where every touchpoint gets equal credit.
He squinted at the screen. "Wait," he said. "Why does the first click get exactly 20%? Why not 21%? Why not 19%? Who decided these weights?"
"We did," I said. "We guessed."
The room got chilly.
This is the problem with Heuristic Models (Linear, Time Decay, U-Shape). They are Subjective. We are imposing our human rules on the data. We are saying, "I feel like the First Click is important."
"I don't pay you to guess," the CEO said. "I pay you to know."
"You're right," I replied. "So let's stop guessing. Let's stop telling the data what to think, and let the data tell us what matters."
Welcome to the world of Algorithmic Attribution. Welcome to Markov Chains.
2. The Concept (The Graph)
Here is what I tell my clients: Think of your marketing as Google Maps.
Please ensure the file is named exactly:
blog 6.1.png
In the old models, we looked at the list of turns (The Journey String).
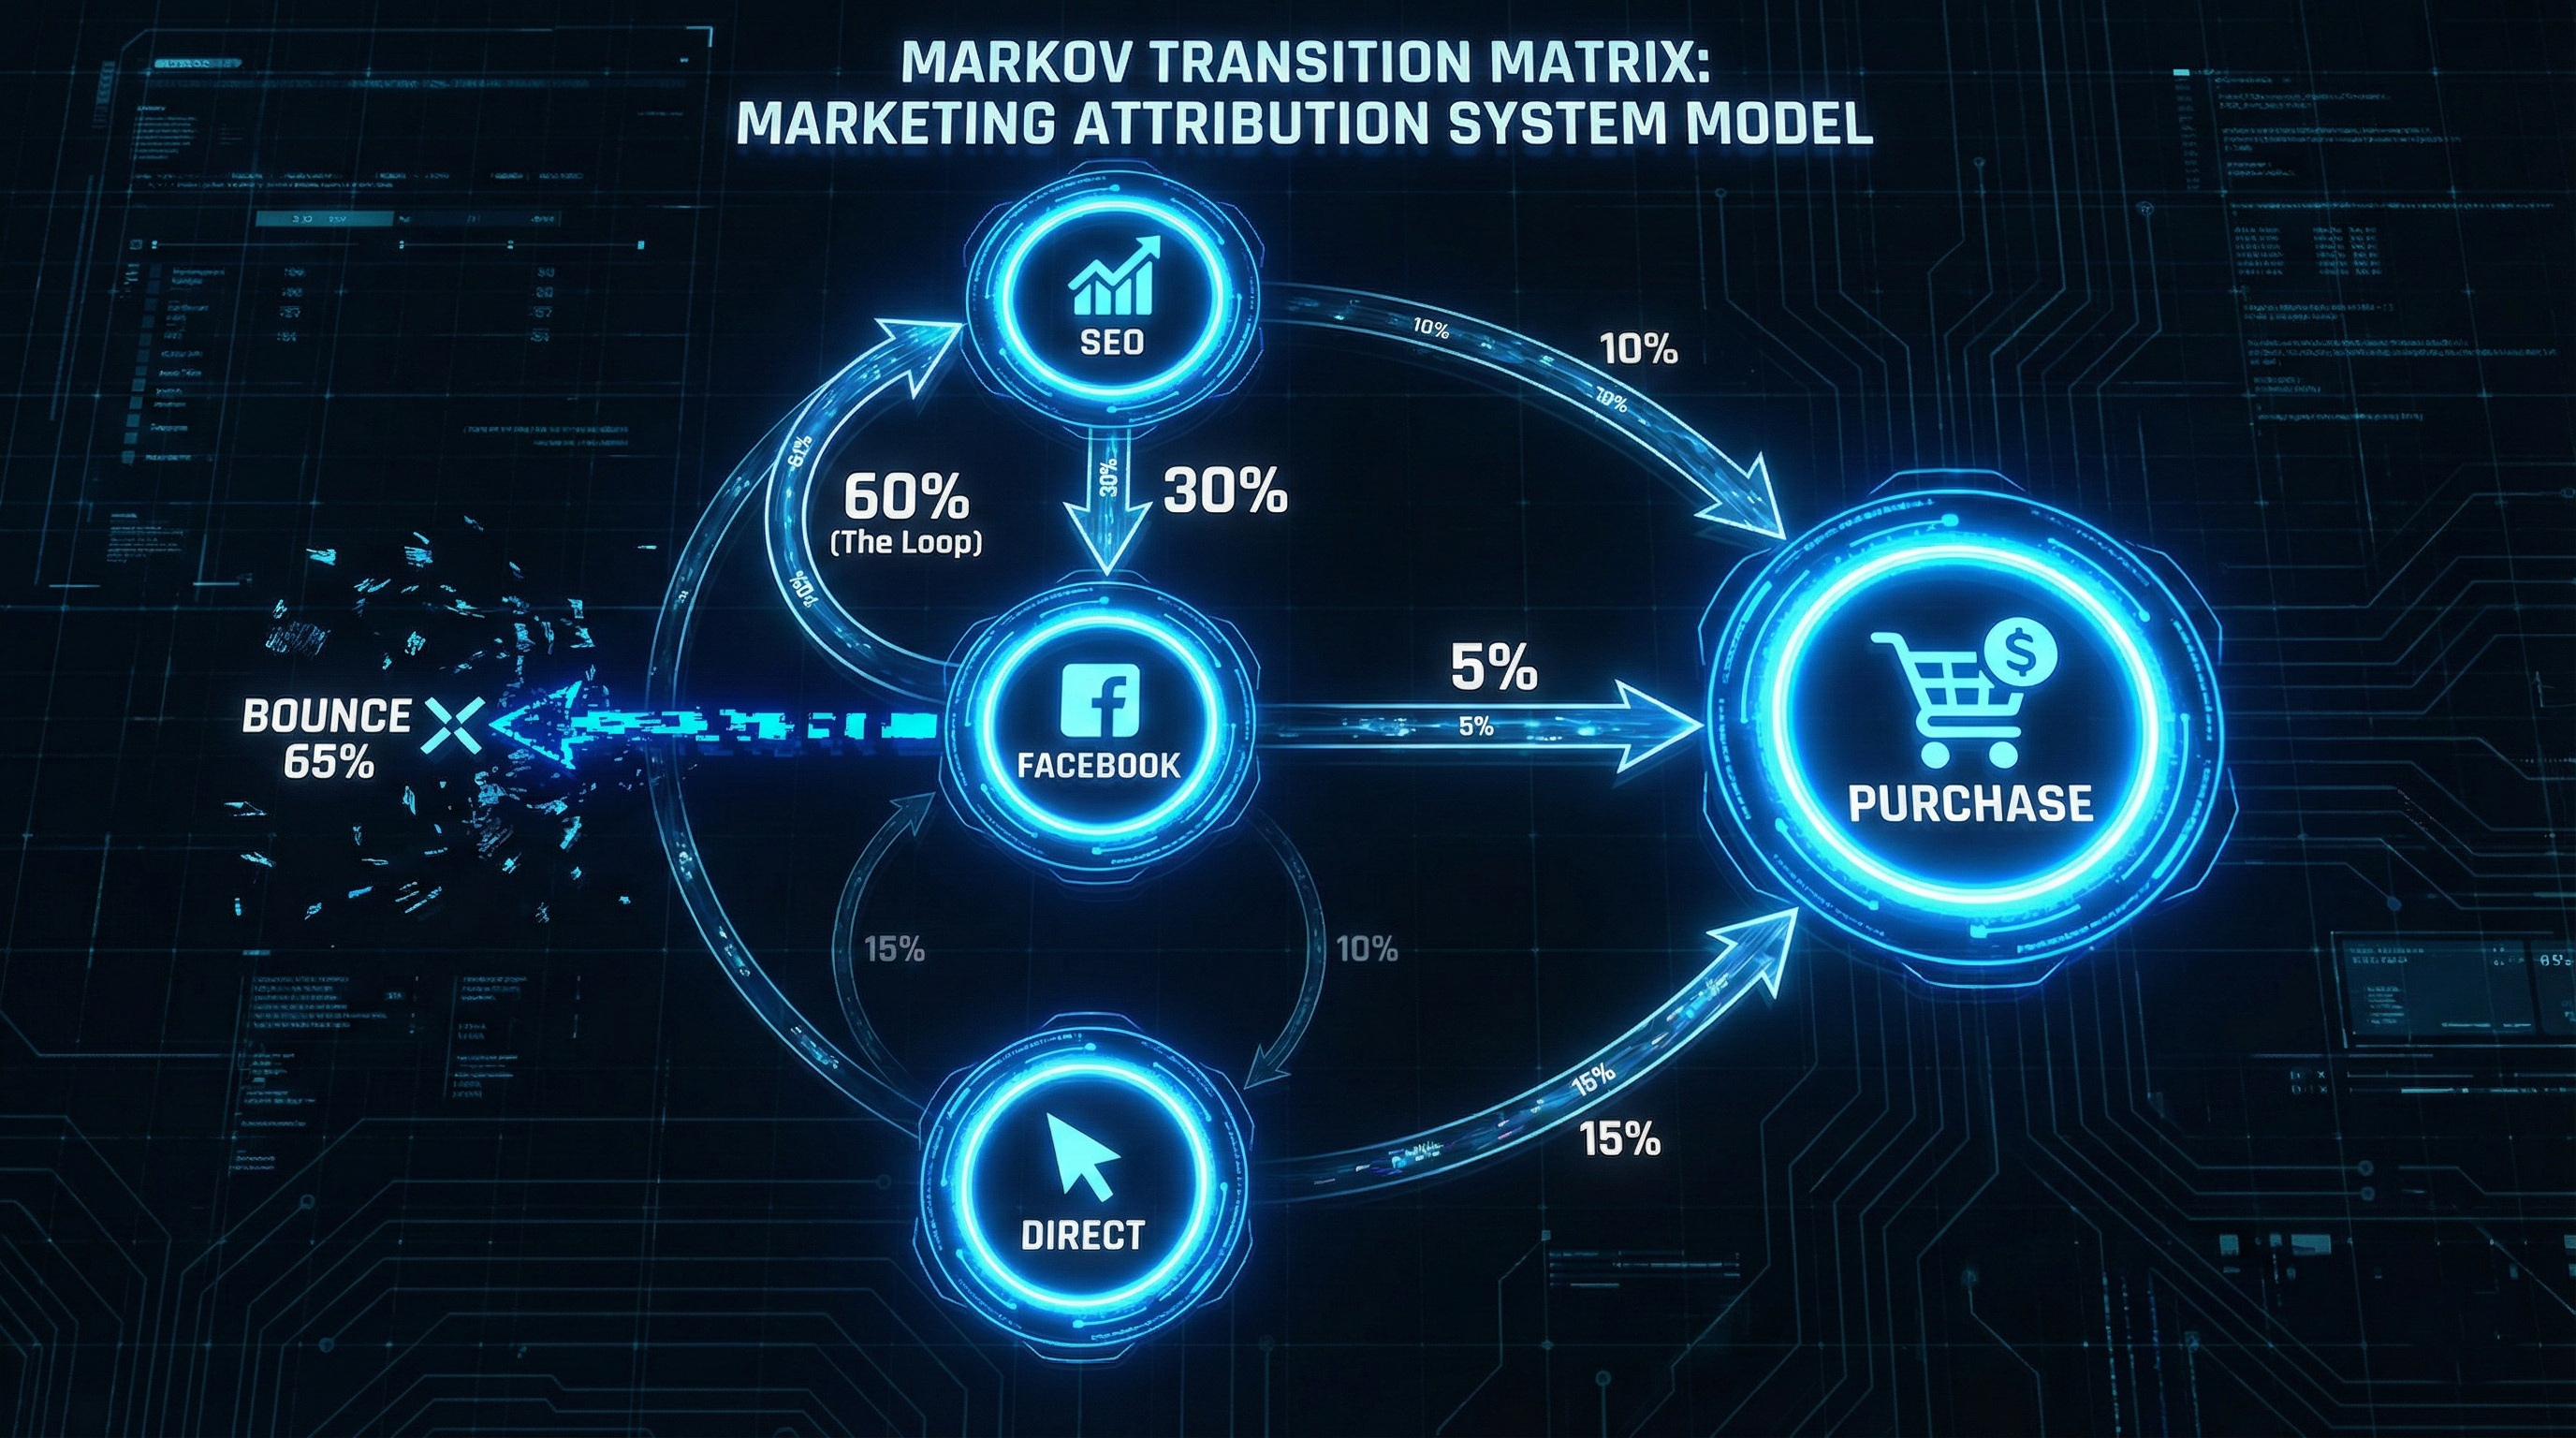
In the Markov model, we look at the Road Network itself.
- Nodes (The Cities): These are your channels (Facebook, SEO, Email).
- Edges (The Roads): These are the probabilities of moving from one city to another.
The algorithm looks at millions of journeys to calculate the probability of movement.
- From Facebook ➔ Site Visit: 30% chance.
- From Site Visit ➔ Purchase: 5% chance.
- From Site Visit ➔ Exit (Bounce): 65% chance.
The "Removal Effect" (The Core Logic)
How do we decide who gets the credit? We play a game of "What If?"
Imagine the entire network of roads. Now, delete the node "Facebook".
Does the path to "Purchase" still exist?
Or does the traffic hit a dead end?
If we remove Facebook and 50% of our conversions become impossible, then Facebook gets 50% of the credit. We measure value by how much the system breaks without you.
3. The Technical Solution (Python Logic)
"SQL is too rigid for this," I told Ujvi's team. "SQL is great for rows, but it's terrible at graph theory. We need Python."
We take the "Journey Strings" we built in Module 5 and feed them into a script that calculates the Transition Matrix.
Here is the conceptual logic we run in the Python environment:
Python: Transition Matriximport pandas as pd
from collections import defaultdict
# 1. Input: The Journey Strings (from Blog 5)
journeys = [
"SEO > Social > Direct > Conversion",
"Social > SEO > Conversion",
"PPC > Conversion"
]
# 2. Calculate Transitions (The Edges)
transitions = defaultdict(int)
for journey in journeys:
steps = journey.split(' > ')
for i in range(len(steps)-1):
# Count how many times User moved from A to B
current_node = steps[i]
next_node = steps[i+1]
transitions[(current_node, next_node)] += 1
# 3. Compute Probabilities (The Matrix)
# (This tells us: If you are at 'SEO', you have a 40% chance of going to 'Social')
transition_matrix = pd.DataFrame(transitions, index=['Count']).T
print(transition_matrix)The Output:
This script generates a Probability Map. It tells us exactly how "sticky" each channel is. It might reveal that Social > Conversion is rare (5%), but Social > SEO is huge (60%). This proves Social is an "Opener," not a "Closer."
4. The Real Data Scenario
We ran this on Order #19387723.
This user was a nightmare. They had 17 touchpoints over 30 days.
Please ensure the file is named exactly:
blog 6.2.png
The Journey of Order #19387723:
Let's look at this graphically.
The Network Graph (Simplified)
The Analysis:
- Linear Model: Sees Direct appear 13 times. It gives Direct the vast majority of the credit (~75%). It gives Social almost nothing because it only appears twice.
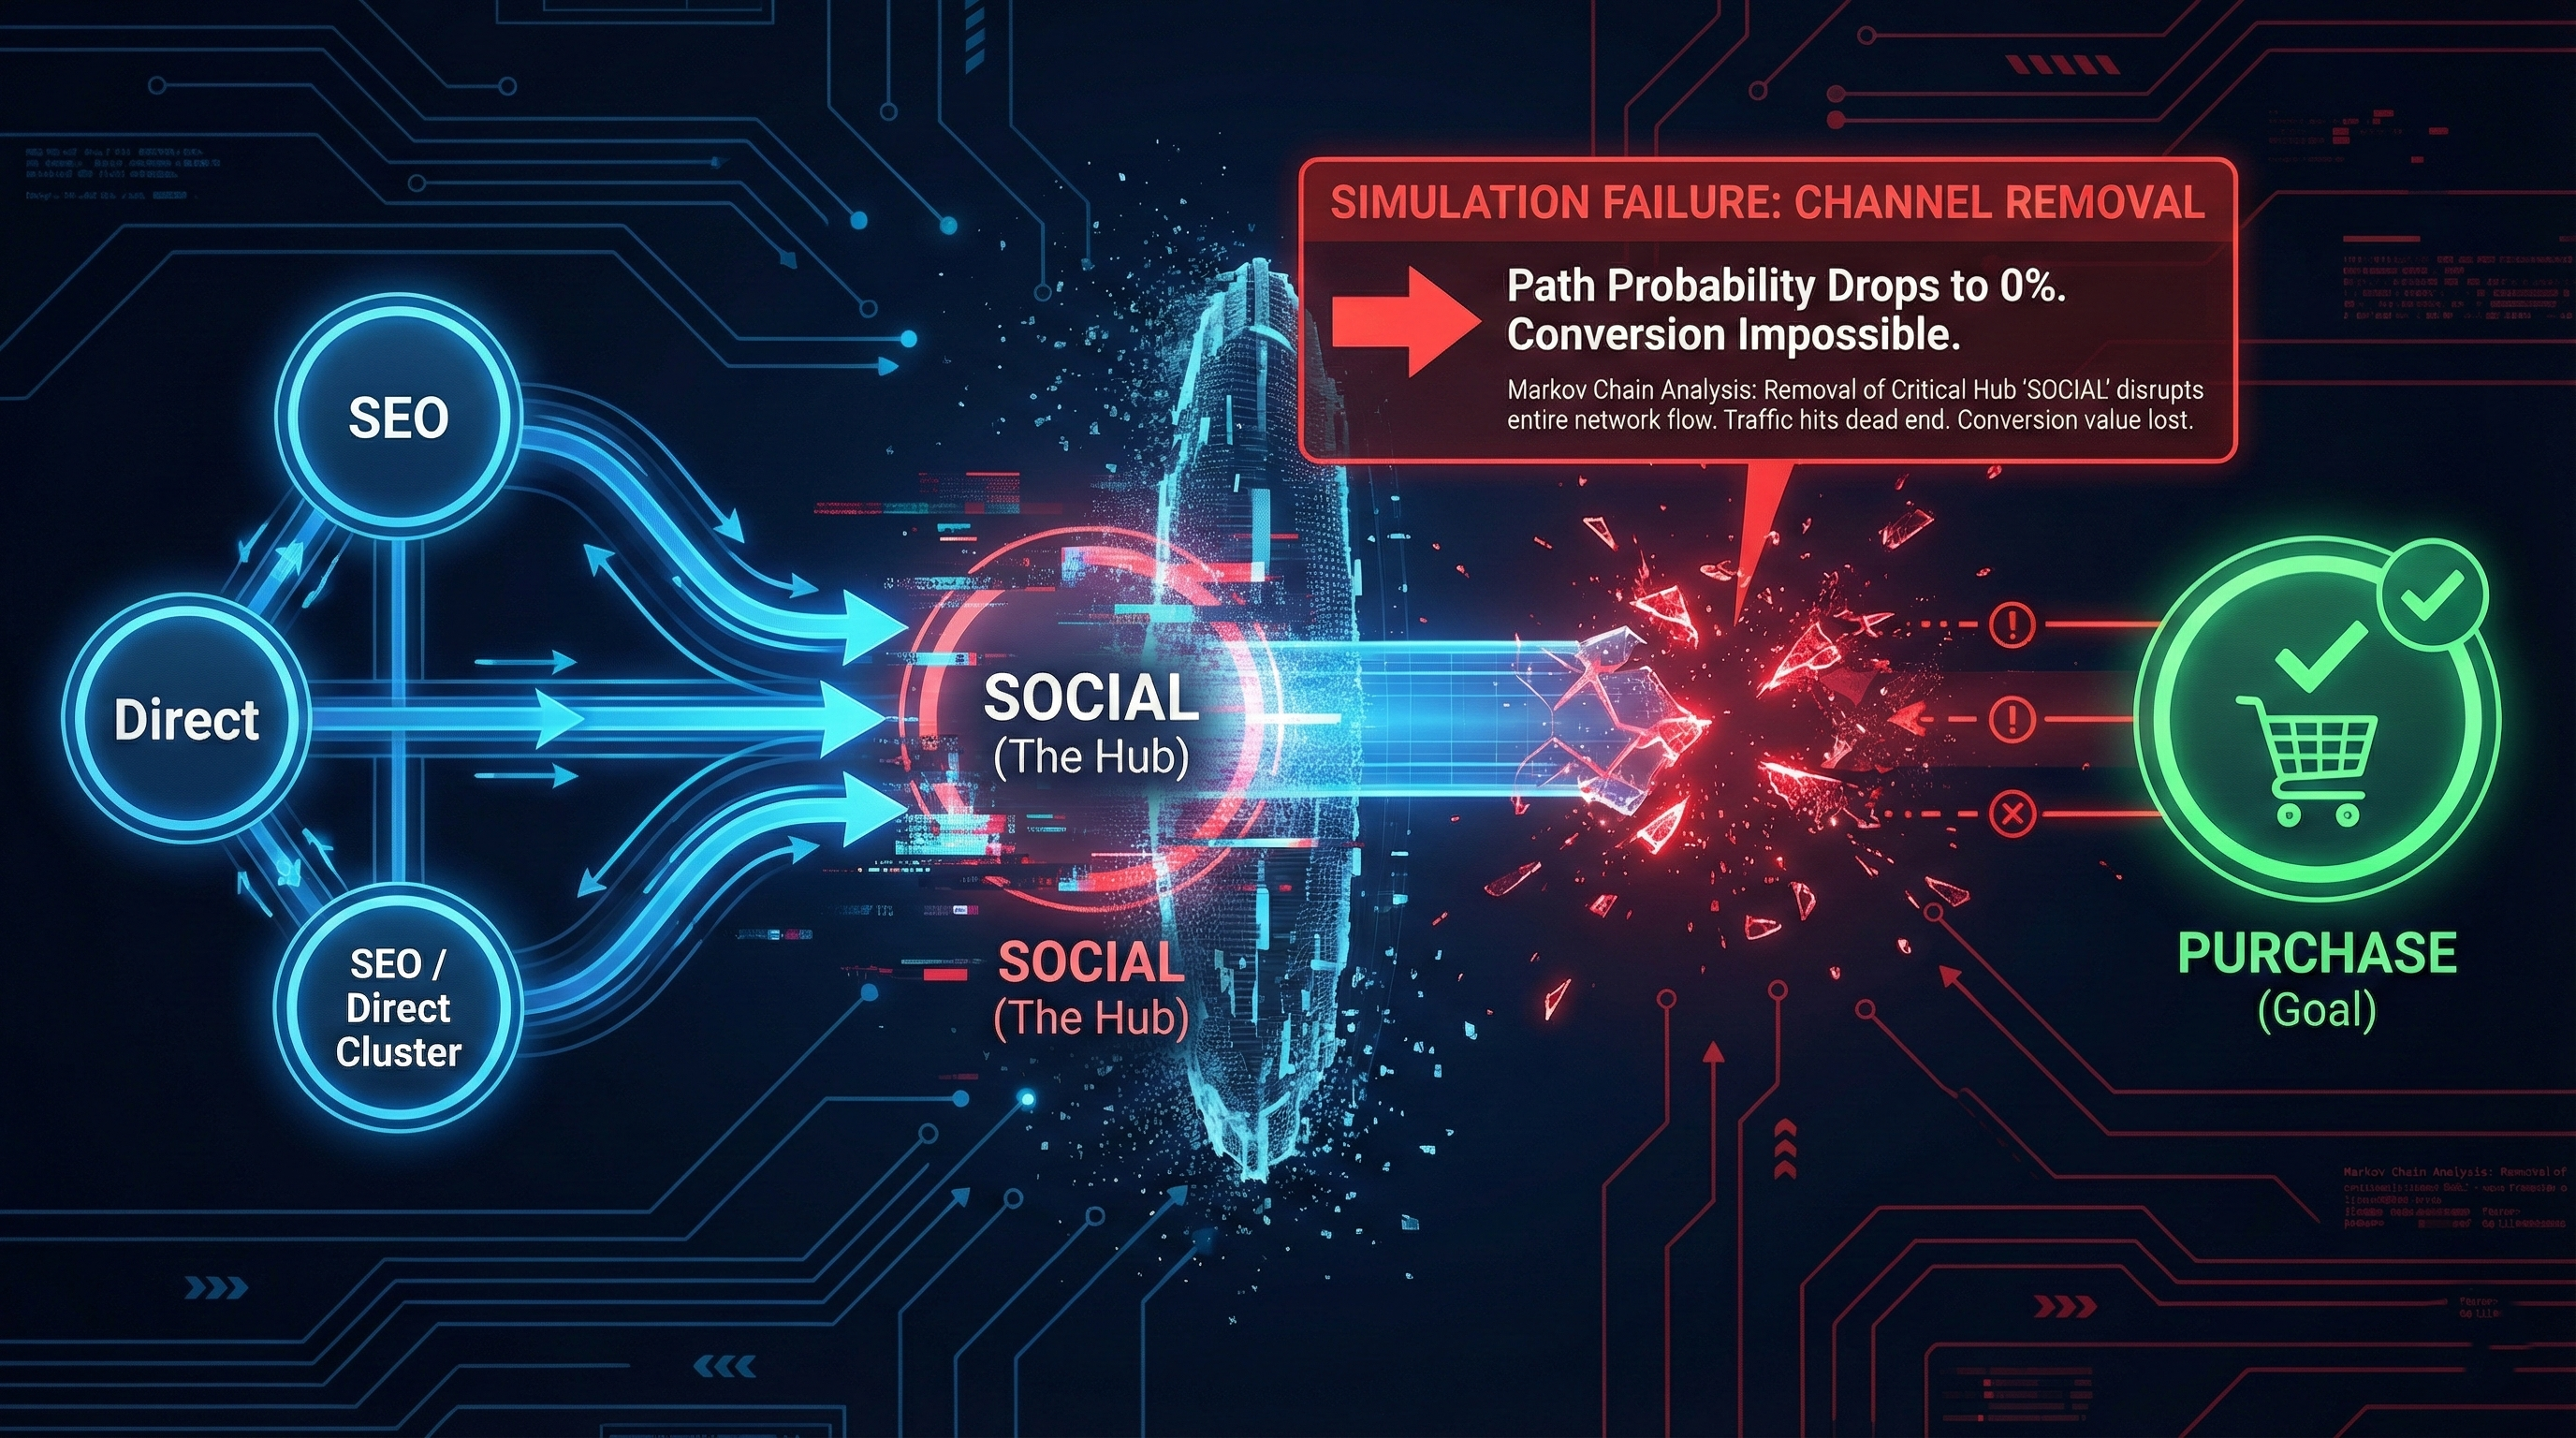
- Markov Model: It looks at the structure. It sees that the user kept falling into a "loop" between Direct and Social. Every time the user was about to leave (Exit), Social brought them back.
- Simulation: Remove Social from the graph.
- Result: The path from Direct to Conversion breaks because the probability drops to zero.
- Verdict: The Markov model gives Social significantly higher credit than Linear did, because it functioned as the critical "Hub" that sustained the journey.
5. The Reality Check
"So this is perfect?" the CEO asked.
"No," I said. "It's better, but it's not perfect."
The Pro: It handles complex, messy loops (like Order #19387723) perfectly. It rewards the "glue" that holds a journey together.
The Con: It is "Memoryless" (The Markov Property).
When the algorithm is at Step 10, it doesn't care about Step 1. It assumes your probability of buying depends only on where you are right now. It ignores the cumulative emotional impact of the brand video you saw 3 weeks ago.
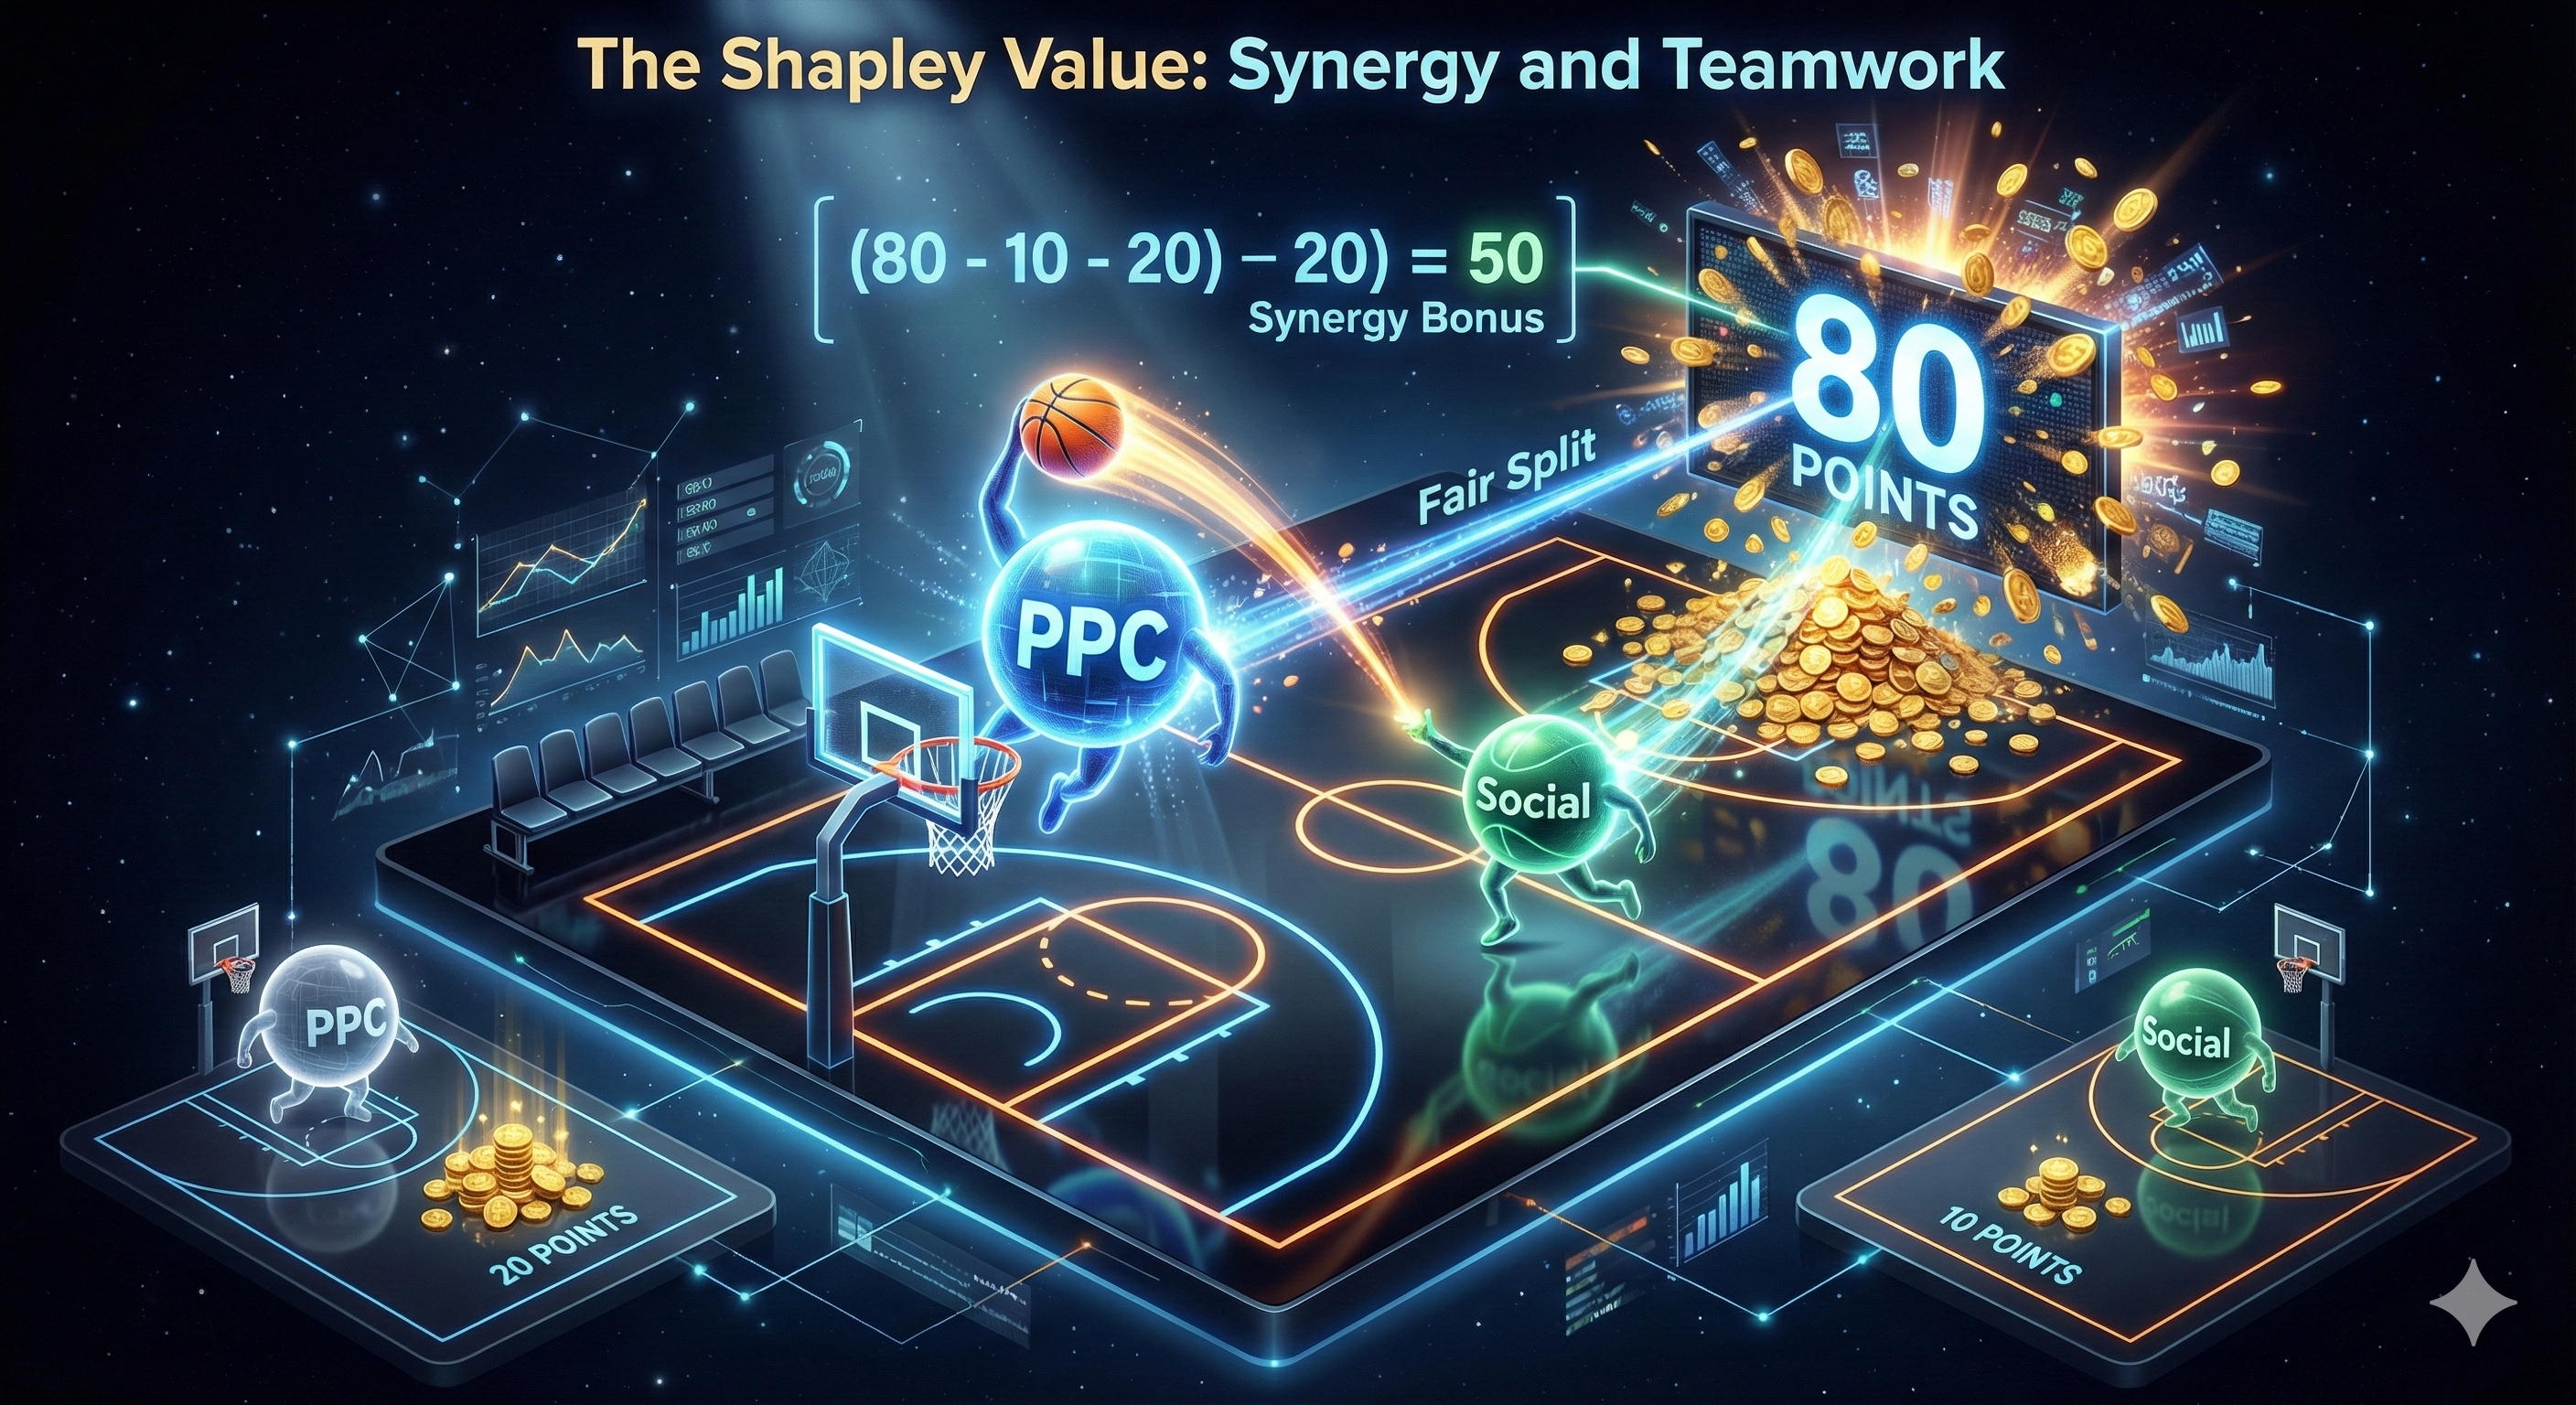
To solve that—to give credit to the players rather than just the positions—we need to leave Graph Theory and enter Game Theory.
We need The Shapley Value (Module 07).
6. Next Steps & Interaction
Ujvi is now looking at a probability map of their marketing. They can see which channels are "Highways" to revenue and which are "Dead Ends."
Over to you: Do you trust the algorithm to pay your bills? Or do you prefer a rule you can see (like First Click)? Tell me in the comments.