
Module 01
The Econometric Mindset
Why MMM? Understanding the shift from user-level tracking (MTA) to top-down statistical inference for measuring incremental impact.
Read ModuleDecoding the Impact of Media Investments on Revenue through Econometrics.
The Context: StyleStream had already spent $42M over three years on digital media. The CFO wasn’t asking for a better dashboard—he was asking whether the next $1M would help or hurt EBITDA.
The Protagonist: Kamal, Lead Marketing Data Scientist at StyleStream.
The Antagonists:
The Marketing Director wanted Kamal to calculate "ROI" (Return on Investment). Kamal refused.
His Hypothesis: "I believe our primary channels (Facebook/Google) have hit Diminishing Returns. Our Average ROAS looks high (3.0x), but our Marginal ROAS (mROAS) is likely below 1.0x. We are losing money on the margin."
His Goal: Build a model to estimate mROAS and optimize budget allocation to maximize total revenue without increasing spend.
Kamal pulled 156 weeks (3 years) of data. It was not clean.
The Challenges & The Fixes:
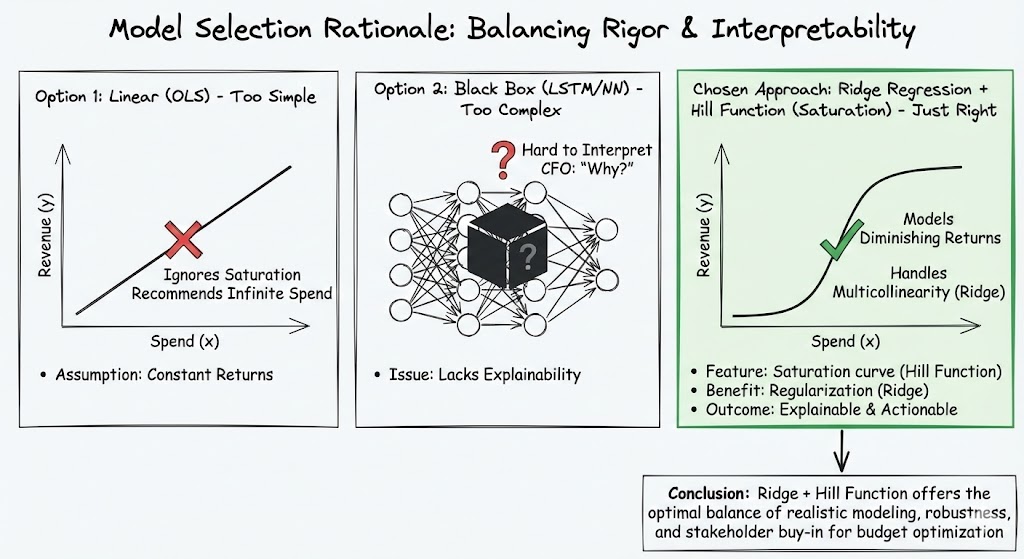
In the technical review, Dr. Rao grilled him on his choice of algorithm.
Kamal had to teach the model how human memory works.
Before the final presentation, Kamal ran rigorous checks.
Kamal stood before the CFO. She displayed the Waterfall Decomposition Chart.
Insight 1: The Baseline Economics
Insight 2: The Marginal Efficiency (The Killer Stat)
| Channel | Avg ROAS (Dashboard) | Marginal ROAS (Real Stats) | Status |
|---|---|---|---|
| 3.5x | 0.6x | 🛑 Over-Saturated | |
| Google Brand | 10.0x | 0.1x | 🛑 Maxed Out |
| TikTok | 1.2x | 1.8x | 🟢 High Potential |
Kamal's Narrative: "CFO, look at Facebook. The dashboard says 3.5x, but the Model proves that the last $50k we spent only brought back $30k (0.6x). We are losing EBITDA on every incremental dollar."
Kamal ran the Budget Optimizer, but she applied real-world constraints to ensure operational feasibility.
To ensure this wasn't a one-off project, Kamal established a governance protocol. The MMM will be refreshed quarterly, with coefficient drift monitoring and a re-estimation trigger if MAPE exceeds 5% or mROAS rank order changes materially.
Structuring time-series data. Aggregating spend, revenue, and controls.
Jump to Modules 1-3 ↓Mathematically representing media reality: Adstock, Saturation & Trends.
Jump to Modules 4-6 ↓From OLS to Bayesian priors. Training the model to find the signal in the noise.
Jump to Modules 7-9 ↓Using the model to forecast revenue, optimize budgets, and calculate ROAS.
Jump to Modules 10-12 ↓
Why MMM? Understanding the shift from user-level tracking (MTA) to top-down statistical inference for measuring incremental impact.
Read Module
Building the Analytical Base Table (ABT). Aggregating weekly media spend, sales data, and competitive metrics for modeling.
Read Module
Exploratory Data Analysis (EDA). Detecting seasonality, identifying outliers, and understanding correlation vs. causation in raw data.
Read Module
Adstock Transformations. Implementing Geometric and Weibull decay to model how long an advertisement influences a consumer after exposure.
Read Module
Modeling Saturation. Using Hill Functions and Power Curves to quantify diminishing returns: when does the next dollar stop working?
Read Module
Control Variables. Engineering features for holidays, macroeconomic indicators (CCI), and competitor activity to isolate true media lift.
Read Module
Regression Mechanics. Comparing OLS with Regularized Regression (Ridge/Lasso) to handle multicollinearity in media channels.
Read Module
Bayesian MMM. How to use Priors (industry knowledge) and Posteriors to build models that make business sense, not just math sense.
Read Module
Model Evaluation. Using R-Squared, MAPE, and experimental calibration (Lift Tests) to select the single best model from thousands of iterations.
Read Module
The Waterfall Chart. Breaking down total sales into baseline (organic) vs. media-driven lift to prove the true value of marketing.
Read Module
The Response Curve. Using marginal ROAS (mROAS) to shift budget from saturated channels to high-potential opportunities.
Read Module
Forecasting. Building a "What-If" simulator to predict next quarter's revenue based on different budget allocation scenarios.
Read Module