From Attribution to ROI | Module 11
1. The Hook
The lights dimmed in the boardroom at Ujvi Candles. It was the final presentation.
I had spent the last ten weeks building a data empire. I walked the executive team through the raw SQL logs, the Markov Chain network graphs, and the Marketing Mix Model (MMM) correlation charts. It was a masterpiece of data science.
The room was silent. I looked at the CFO.
He wasn't looking at the screen. He was looking at his notebook. He leaned back, took off his glasses, and said:
"This is a very pretty dashboard. But I have $100,000 to spend next month. Where do I put it to get the most profit?"
He didn't care about "nodes." He didn't care about "cookies." He cared about Margin.
In that moment, the difference between Attribution and Optimization became clear.
Attribution is looking backward to see who got the credit.
Optimization is looking forward to see who makes the money.
"You're right," I said. "Let's stop talking about credit. Let's talk about Incrementality."
2. The "Aha!" Moment
Here is what I tell my clients: Attribution models can lie. Even the smart ones.
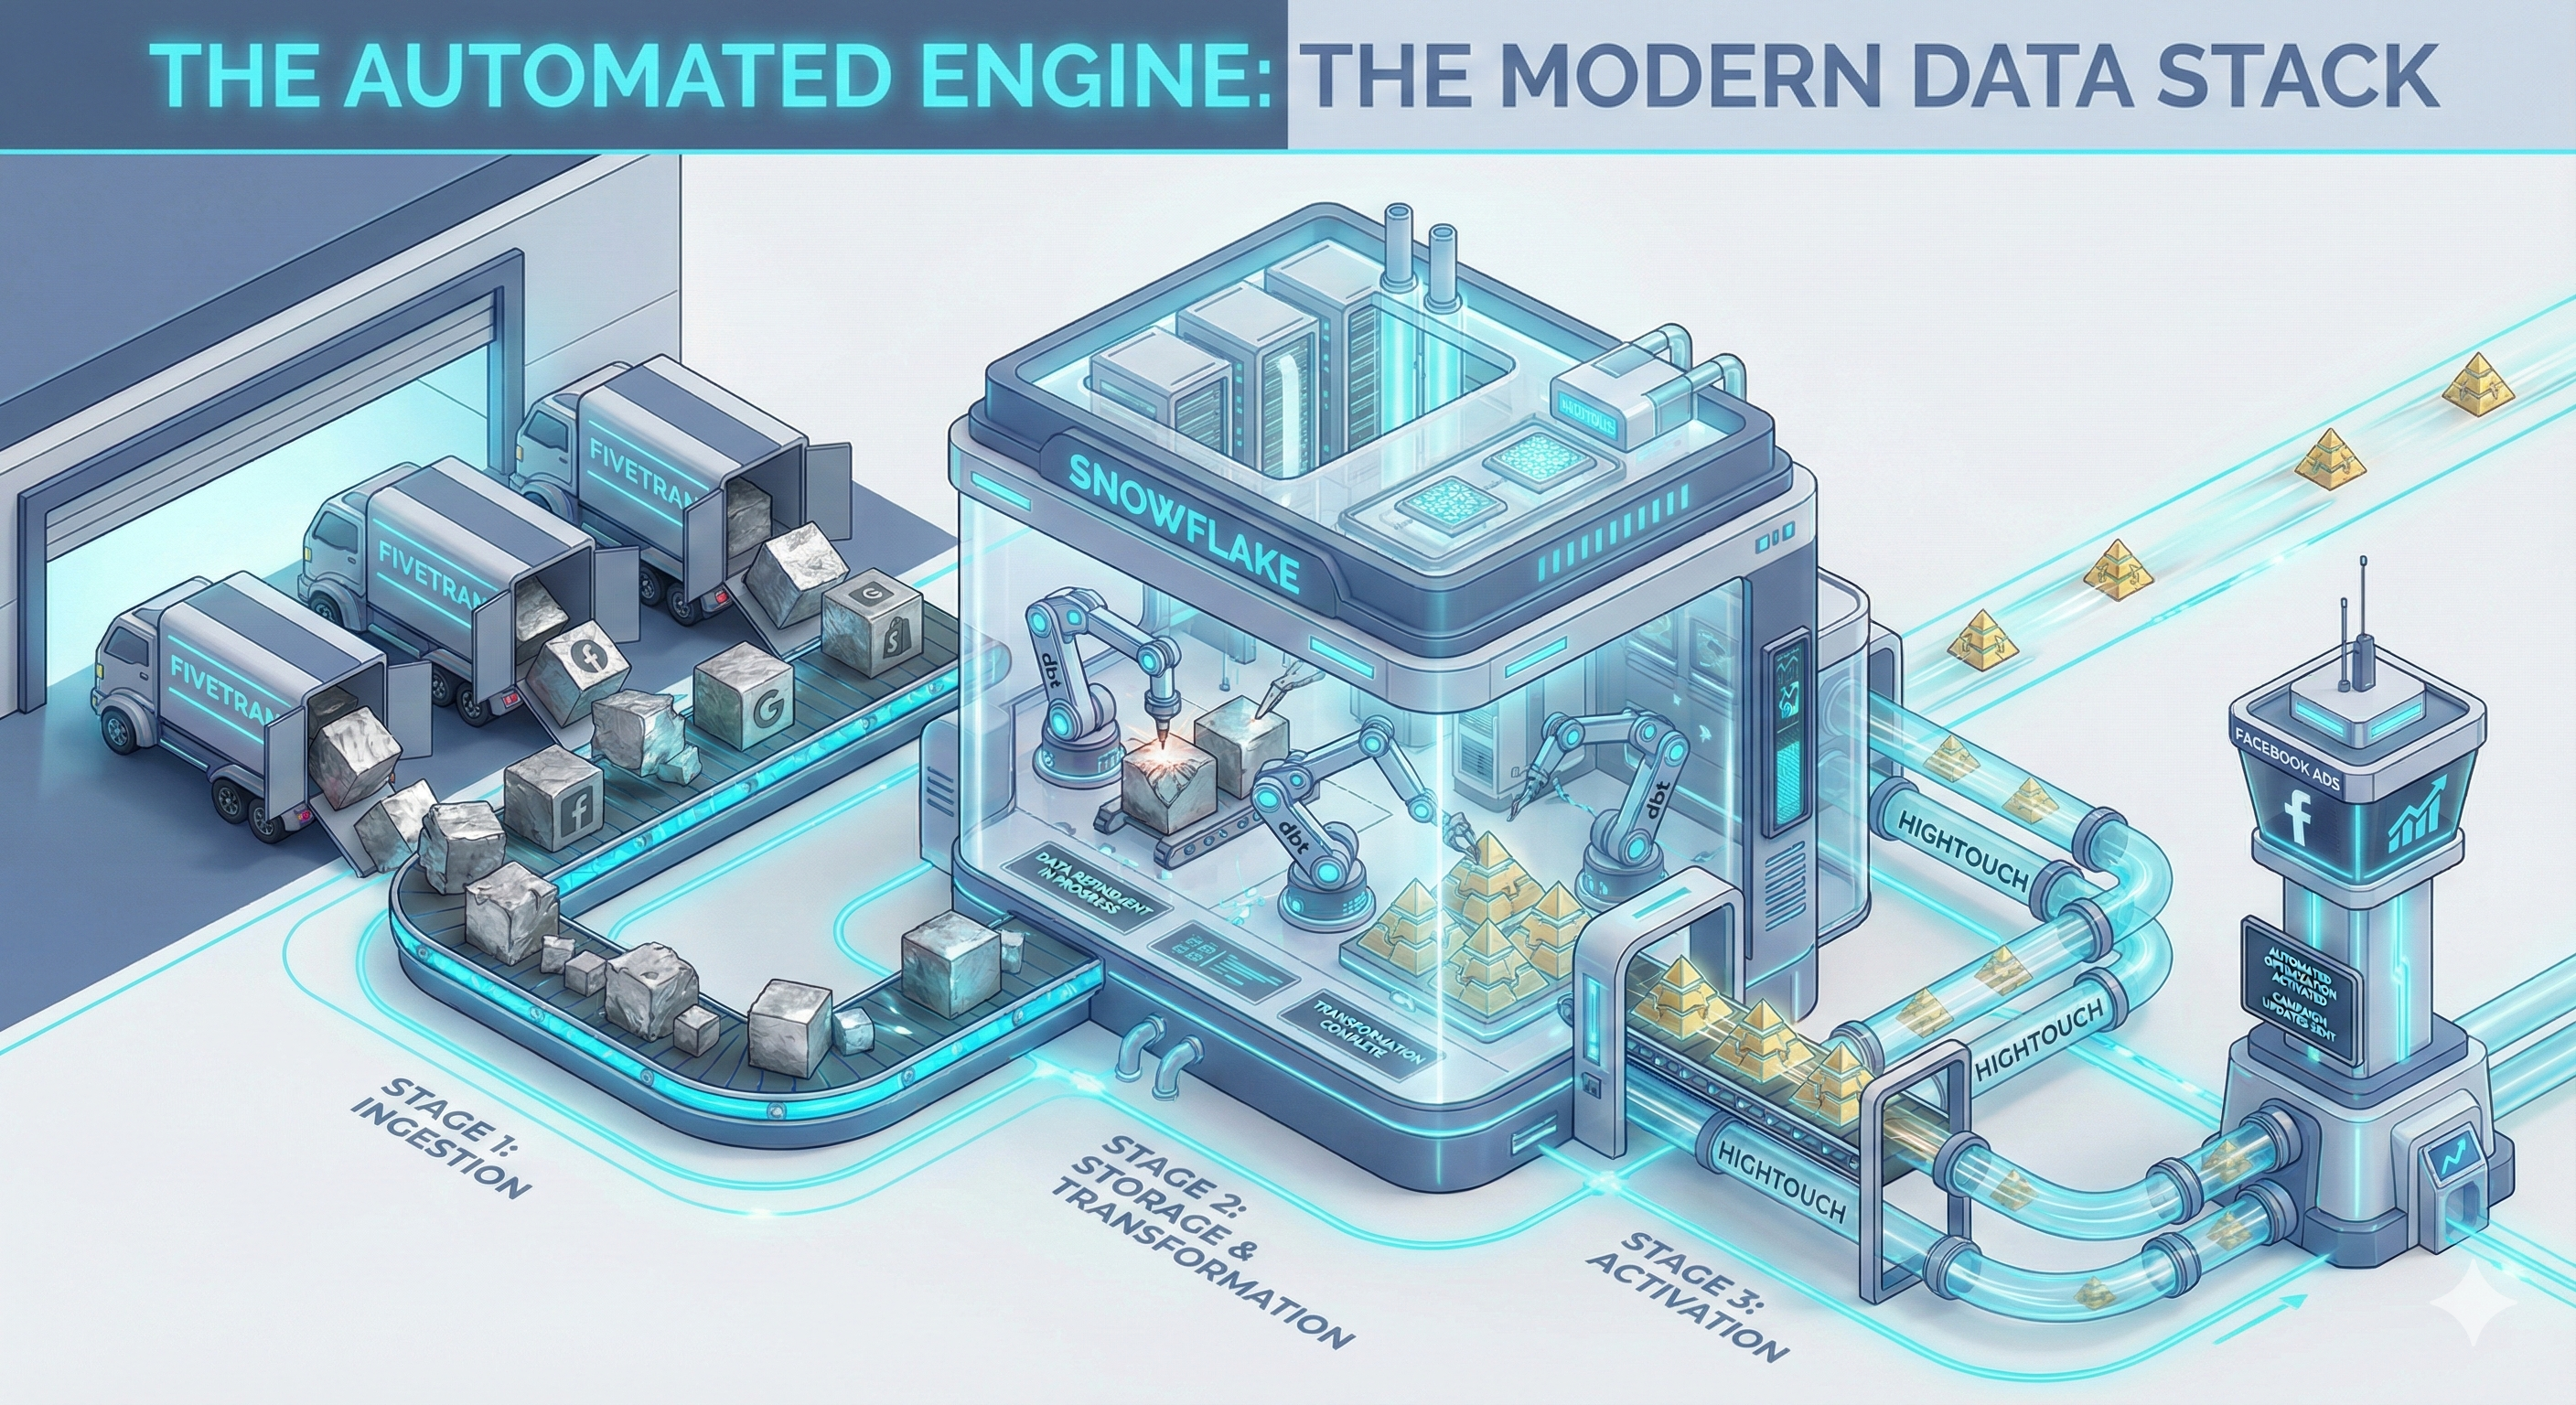
Please ensure the file is named exactly:
blog 11.1.jpg
Let's talk about the "Branded Search Trap."
Ujvi spends $10,000/month bidding on the keyword "Ujvi Candles" on Google.
Attribution says: "Wow! This campaign has a 50x ROAS (Return on Ad Spend)! Every dollar we put in prints $50!"
The CFO loves this number. But the Growth Lead should be suspicious.
Incrementality asks: "If we turned this ad OFF, what would happen?"
Most likely, the user would have just clicked the Organic SEO link sitting one inch below the ad. They were already searching for you. You didn't "cause" the sale; you just paid a toll to collect it.
- Attributed Revenue: $500,000
- Incremental Revenue: $0 (They would have bought anyway).
We need to move our goalpost from ROAS (Vanity Metric) to iROAS (Incremental Return on Ad Spend).
3. The Solution (The Experiment)
"Models are just hypotheses," I told the CFO. "Experiments are the truth."
To answer his question—where to put the $100k—we can't just trust the Markov Chain. We need to validate it with a Holdout Test (or Geo-Lift Test).
We don't need Python code for this; we need Logic.
The Setup:
We take two similar markets.
- Group A (California): Keep Ads ON. (The Treatment).
- Group B (New York): Turn Ads OFF. (The Control).
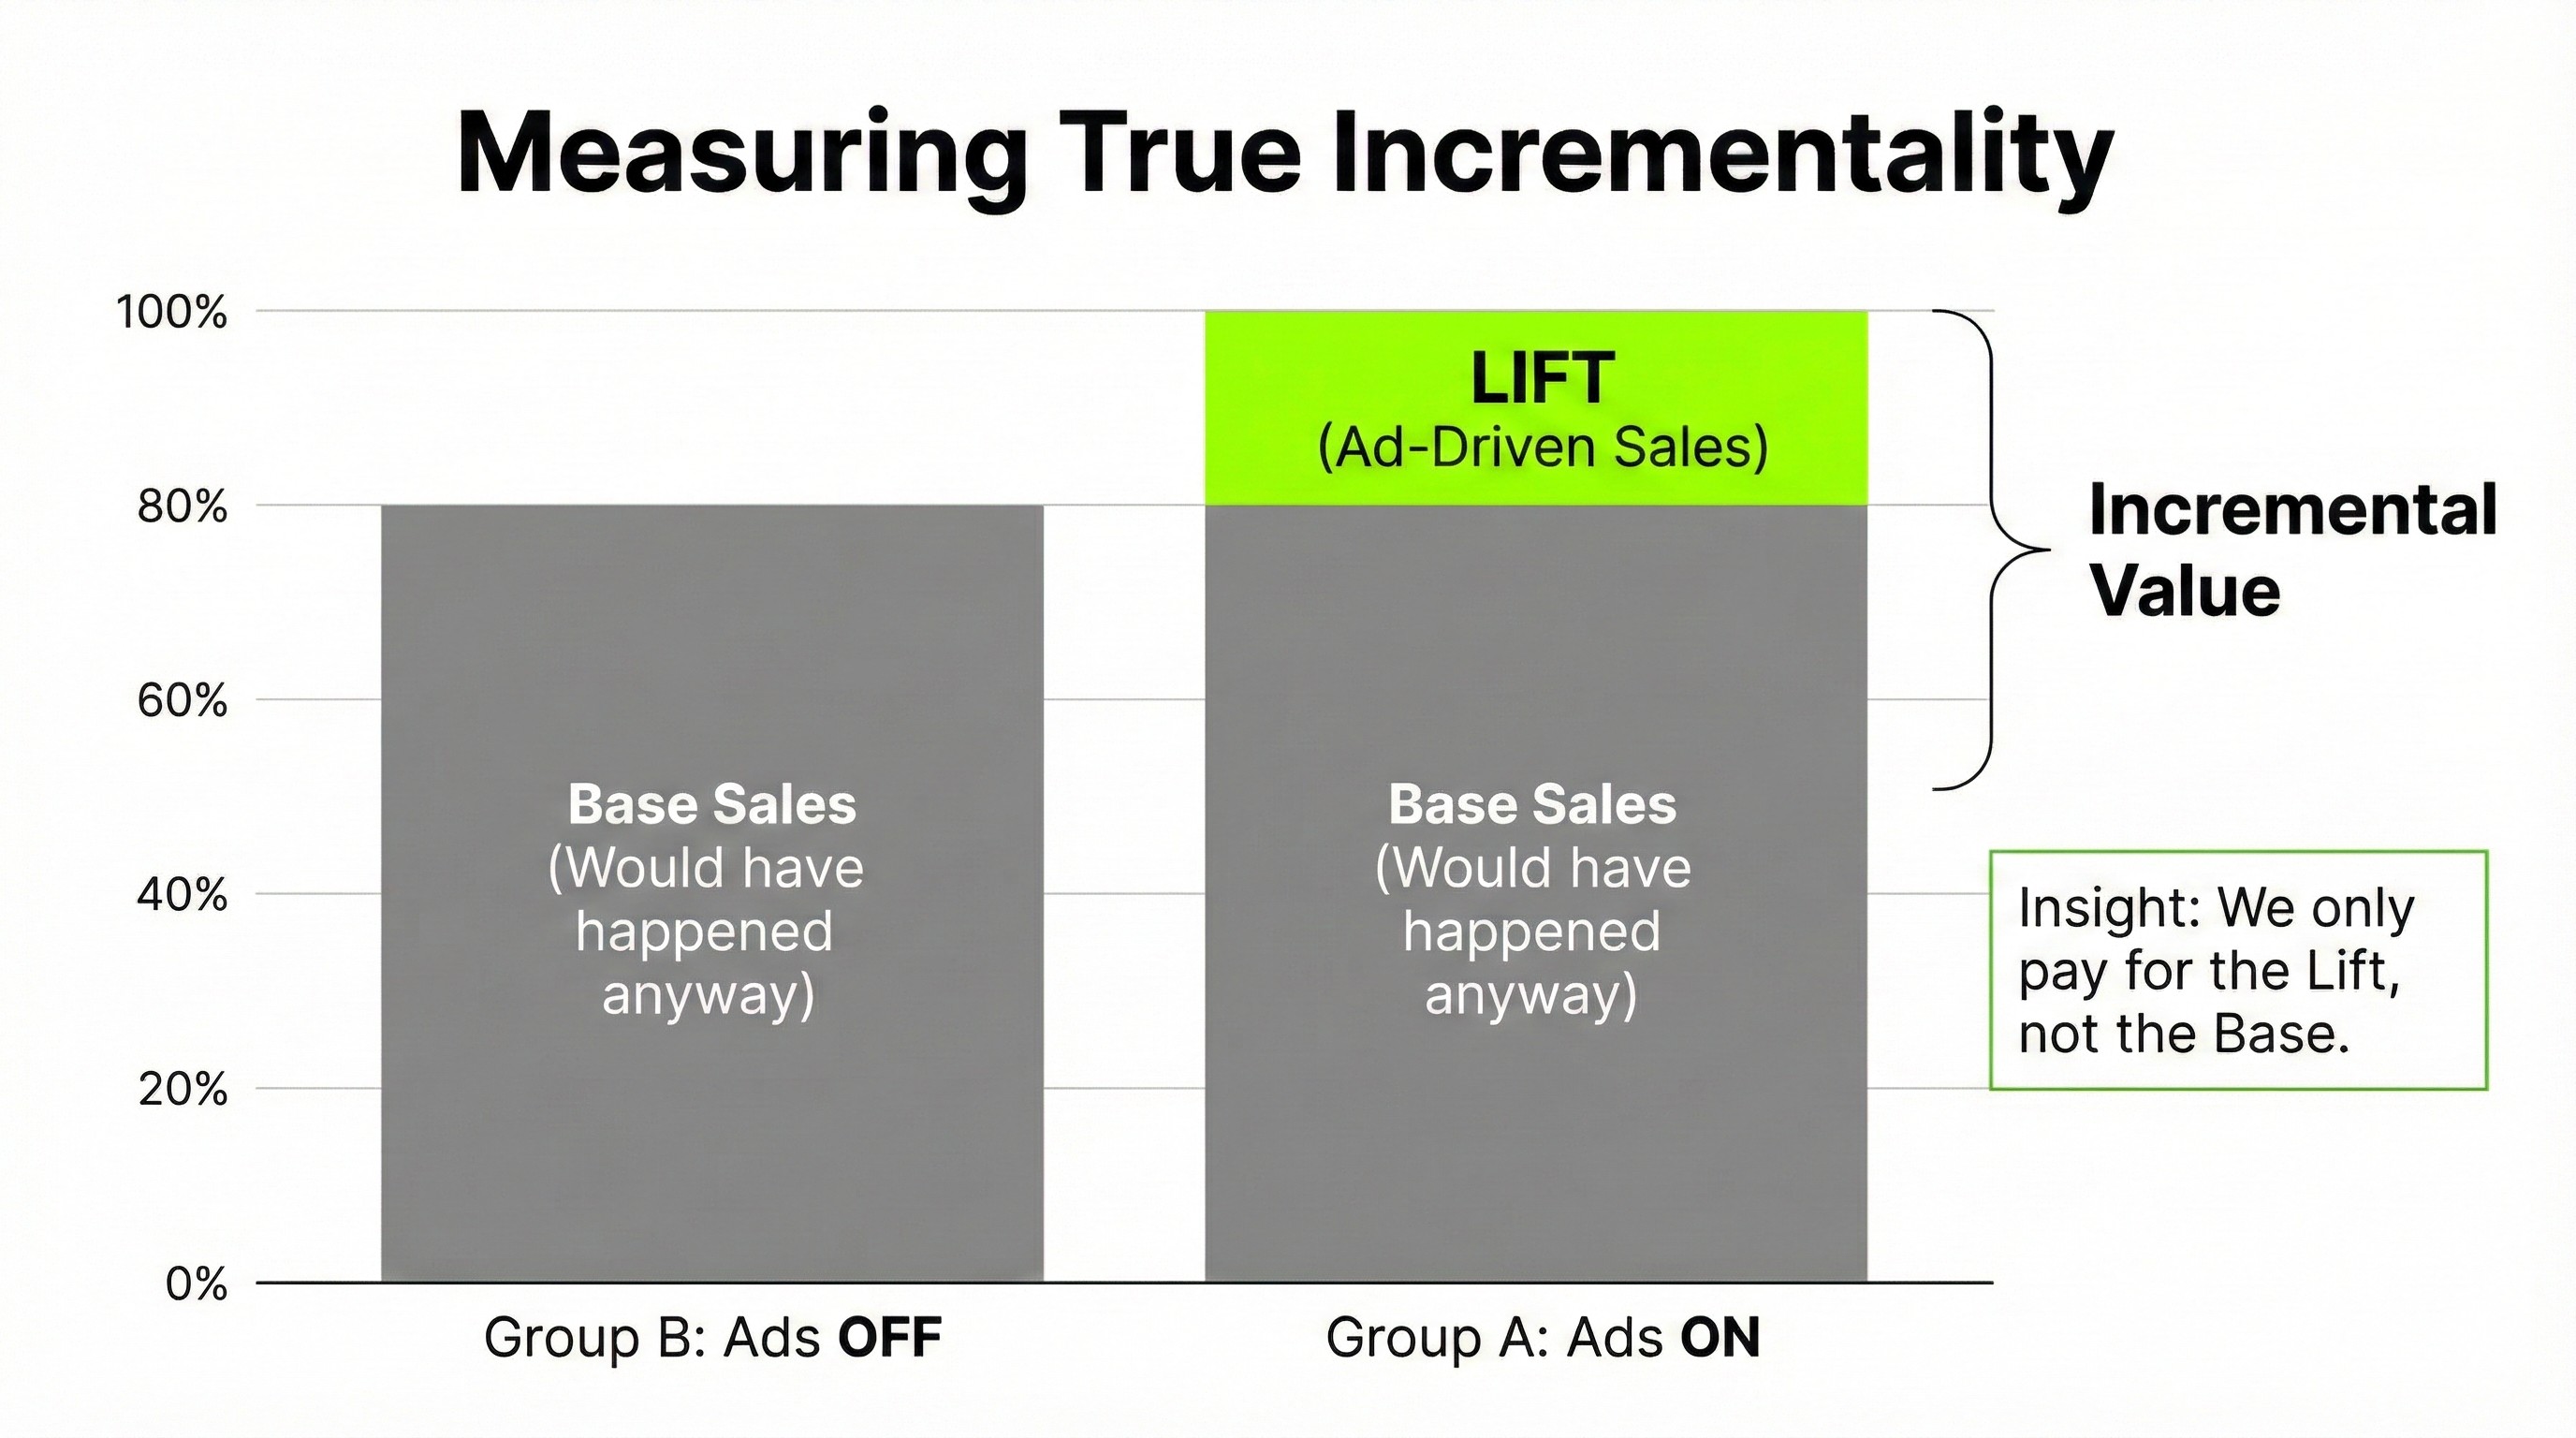
Please ensure the file is named exactly:
blog 11.2.jpg
The Visualization: The Lift Chart
Result: The Ad only "caused" the top block. The rest was happening anyway.
- If we turn off ads in New York and sales drop by 50%, the ads are highly incremental.
- If we turn off ads in New York and sales stay flat, the ads are burning money.
4. The Reality Check (The Calculation)
"Okay," the CFO said. "Let's apply this to next month's budget. I have two choices for my next $50,000."
Here were the two contenders on the table:
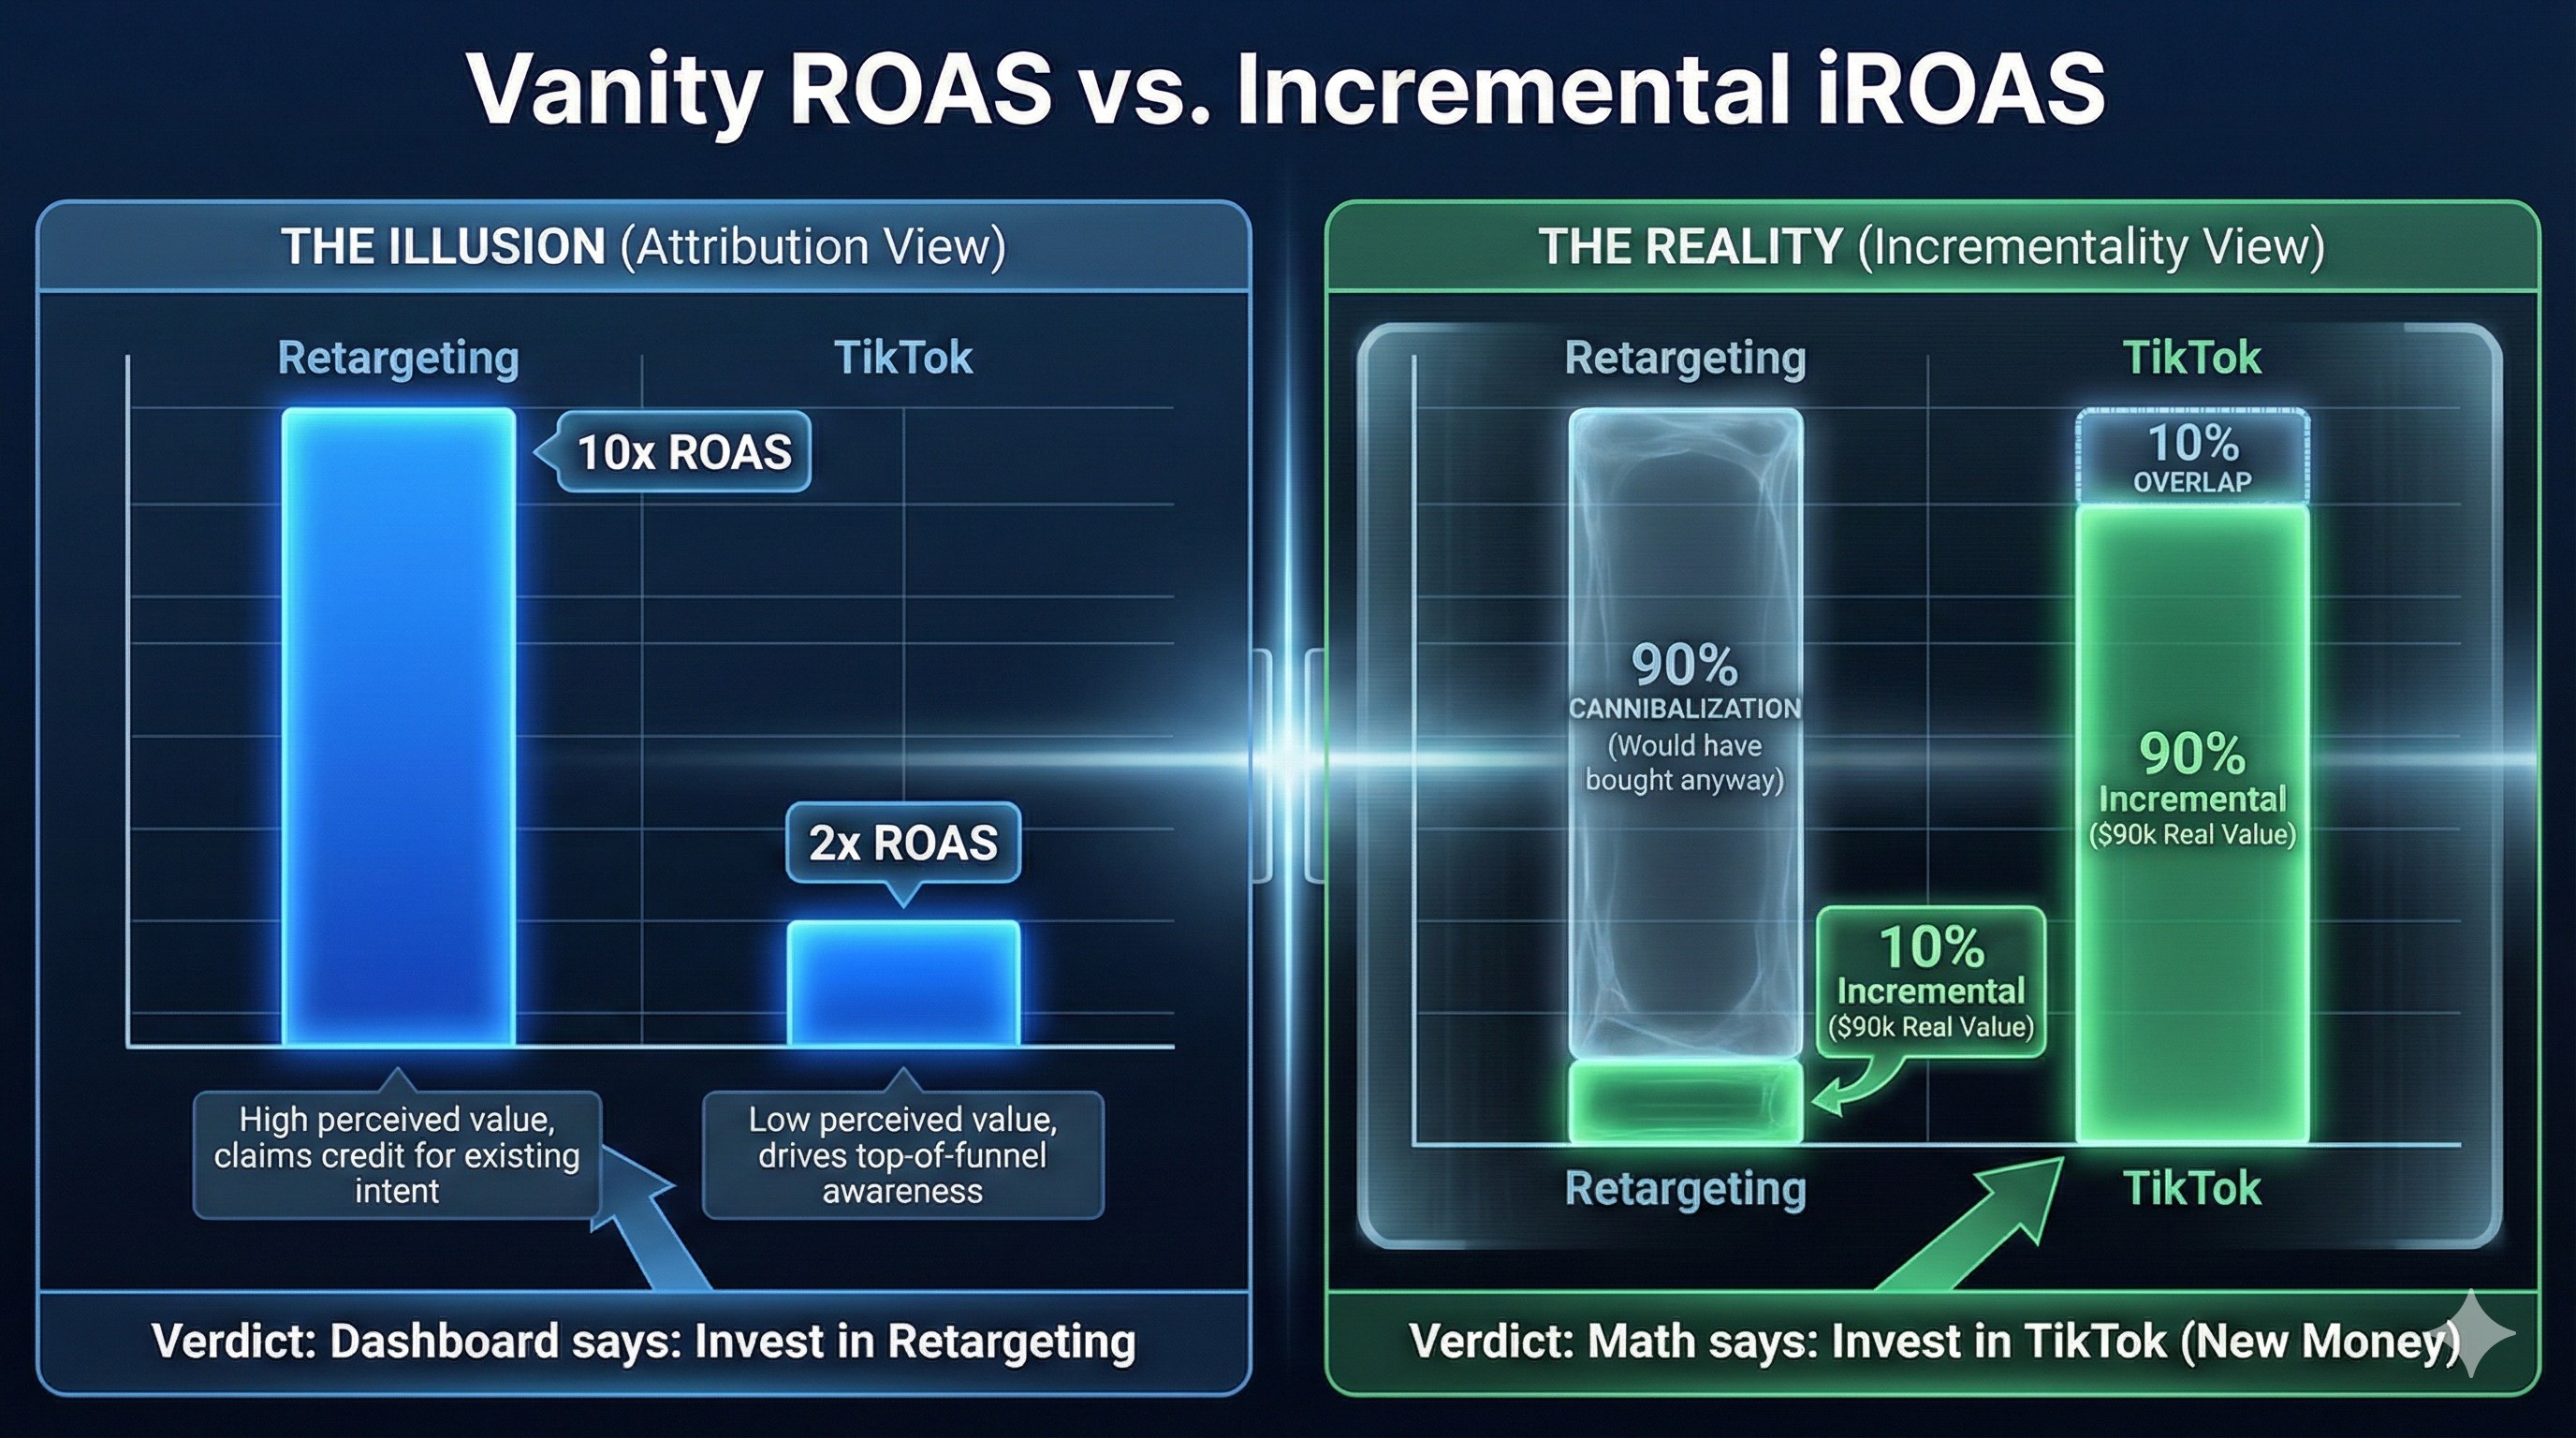
- TikTok Ads: Attributed ROAS 2.0x. (Looks weak).
- Retargeting Ads: Attributed ROAS 10.0x. (Looks amazing).
If you follow the dashboard, you dump everything into Retargeting. But let's apply the Incrementality Factor.
- TikTok: Drives new traffic. If we turn it off, those people never find us. Incrementality = 90%.
- Retargeting: Harasses people who already visited the site. Many would have returned via email or direct anyway. Incrementality = 10%.
The Math (Real Value)
The Decision:
"Cut the budget for the 'high-performing' Retargeting," I said. "And fund the 'low-performing' TikTok."
The CFO was shocked. "You want me to invest in the lower ROAS channel?"
"I want you to invest in the channel that brings in New Money," I replied. "Not the channel that claims credit for money you already had."
5. Next Steps & Interaction
The meeting ended. The CFO signed the check for the TikTok campaign. Ujvi Candles was no longer guessing.
This brings us to the end of our journey. We have gone from messy CSVs to a sophisticated Decision Engine. But remember, this isn't a project you finish. It's a loop you run.
The Optimization Loop:
- Track: Capture the data (SQL - Blog 1).
- Model: Map the journey (Markov - Blog 6).
- Validate: Check the truth (Lift Tests - Blog 11).
- Optimize: Move the money (CFO Decision).
- Repeat.
Data doesn't make you money. Decisions do. Go make better decisions.
Over to you: This is the end of the series! Which chapter saved your sanity the most? Was it the SQL setup, the Markov Chains, or the realization that "Last Click" is lying to you? Drop a comment below, and let's connect on LinkedIn for Part 2!