Strategy: MTA vs. MMM | Module 10
1. The Hook
The air conditioning was humming, but the strategy room at Ujvi Candles felt hot. It was the Annual Budget Meeting, and a civil war had just broken out.
On one side sat the Digital Director. "We need to invest $50,000 in a new Multi-Touch Attribution (MTA) tool," he argued, pulling up slides of pixel-perfect tracking. "I need to know if the 'Red Candle' ad on TikTok is beating the 'Blue Candle' ad."
On the other side sat the Brand Director. "No," she countered. "We're launching TV and Billboards next year. Pixels can't track that. We need to invest that $50k in a Marketing Mix Modeling (MMM) study."
They both turned to me. "You're the Data Scientist. Which one wins?"
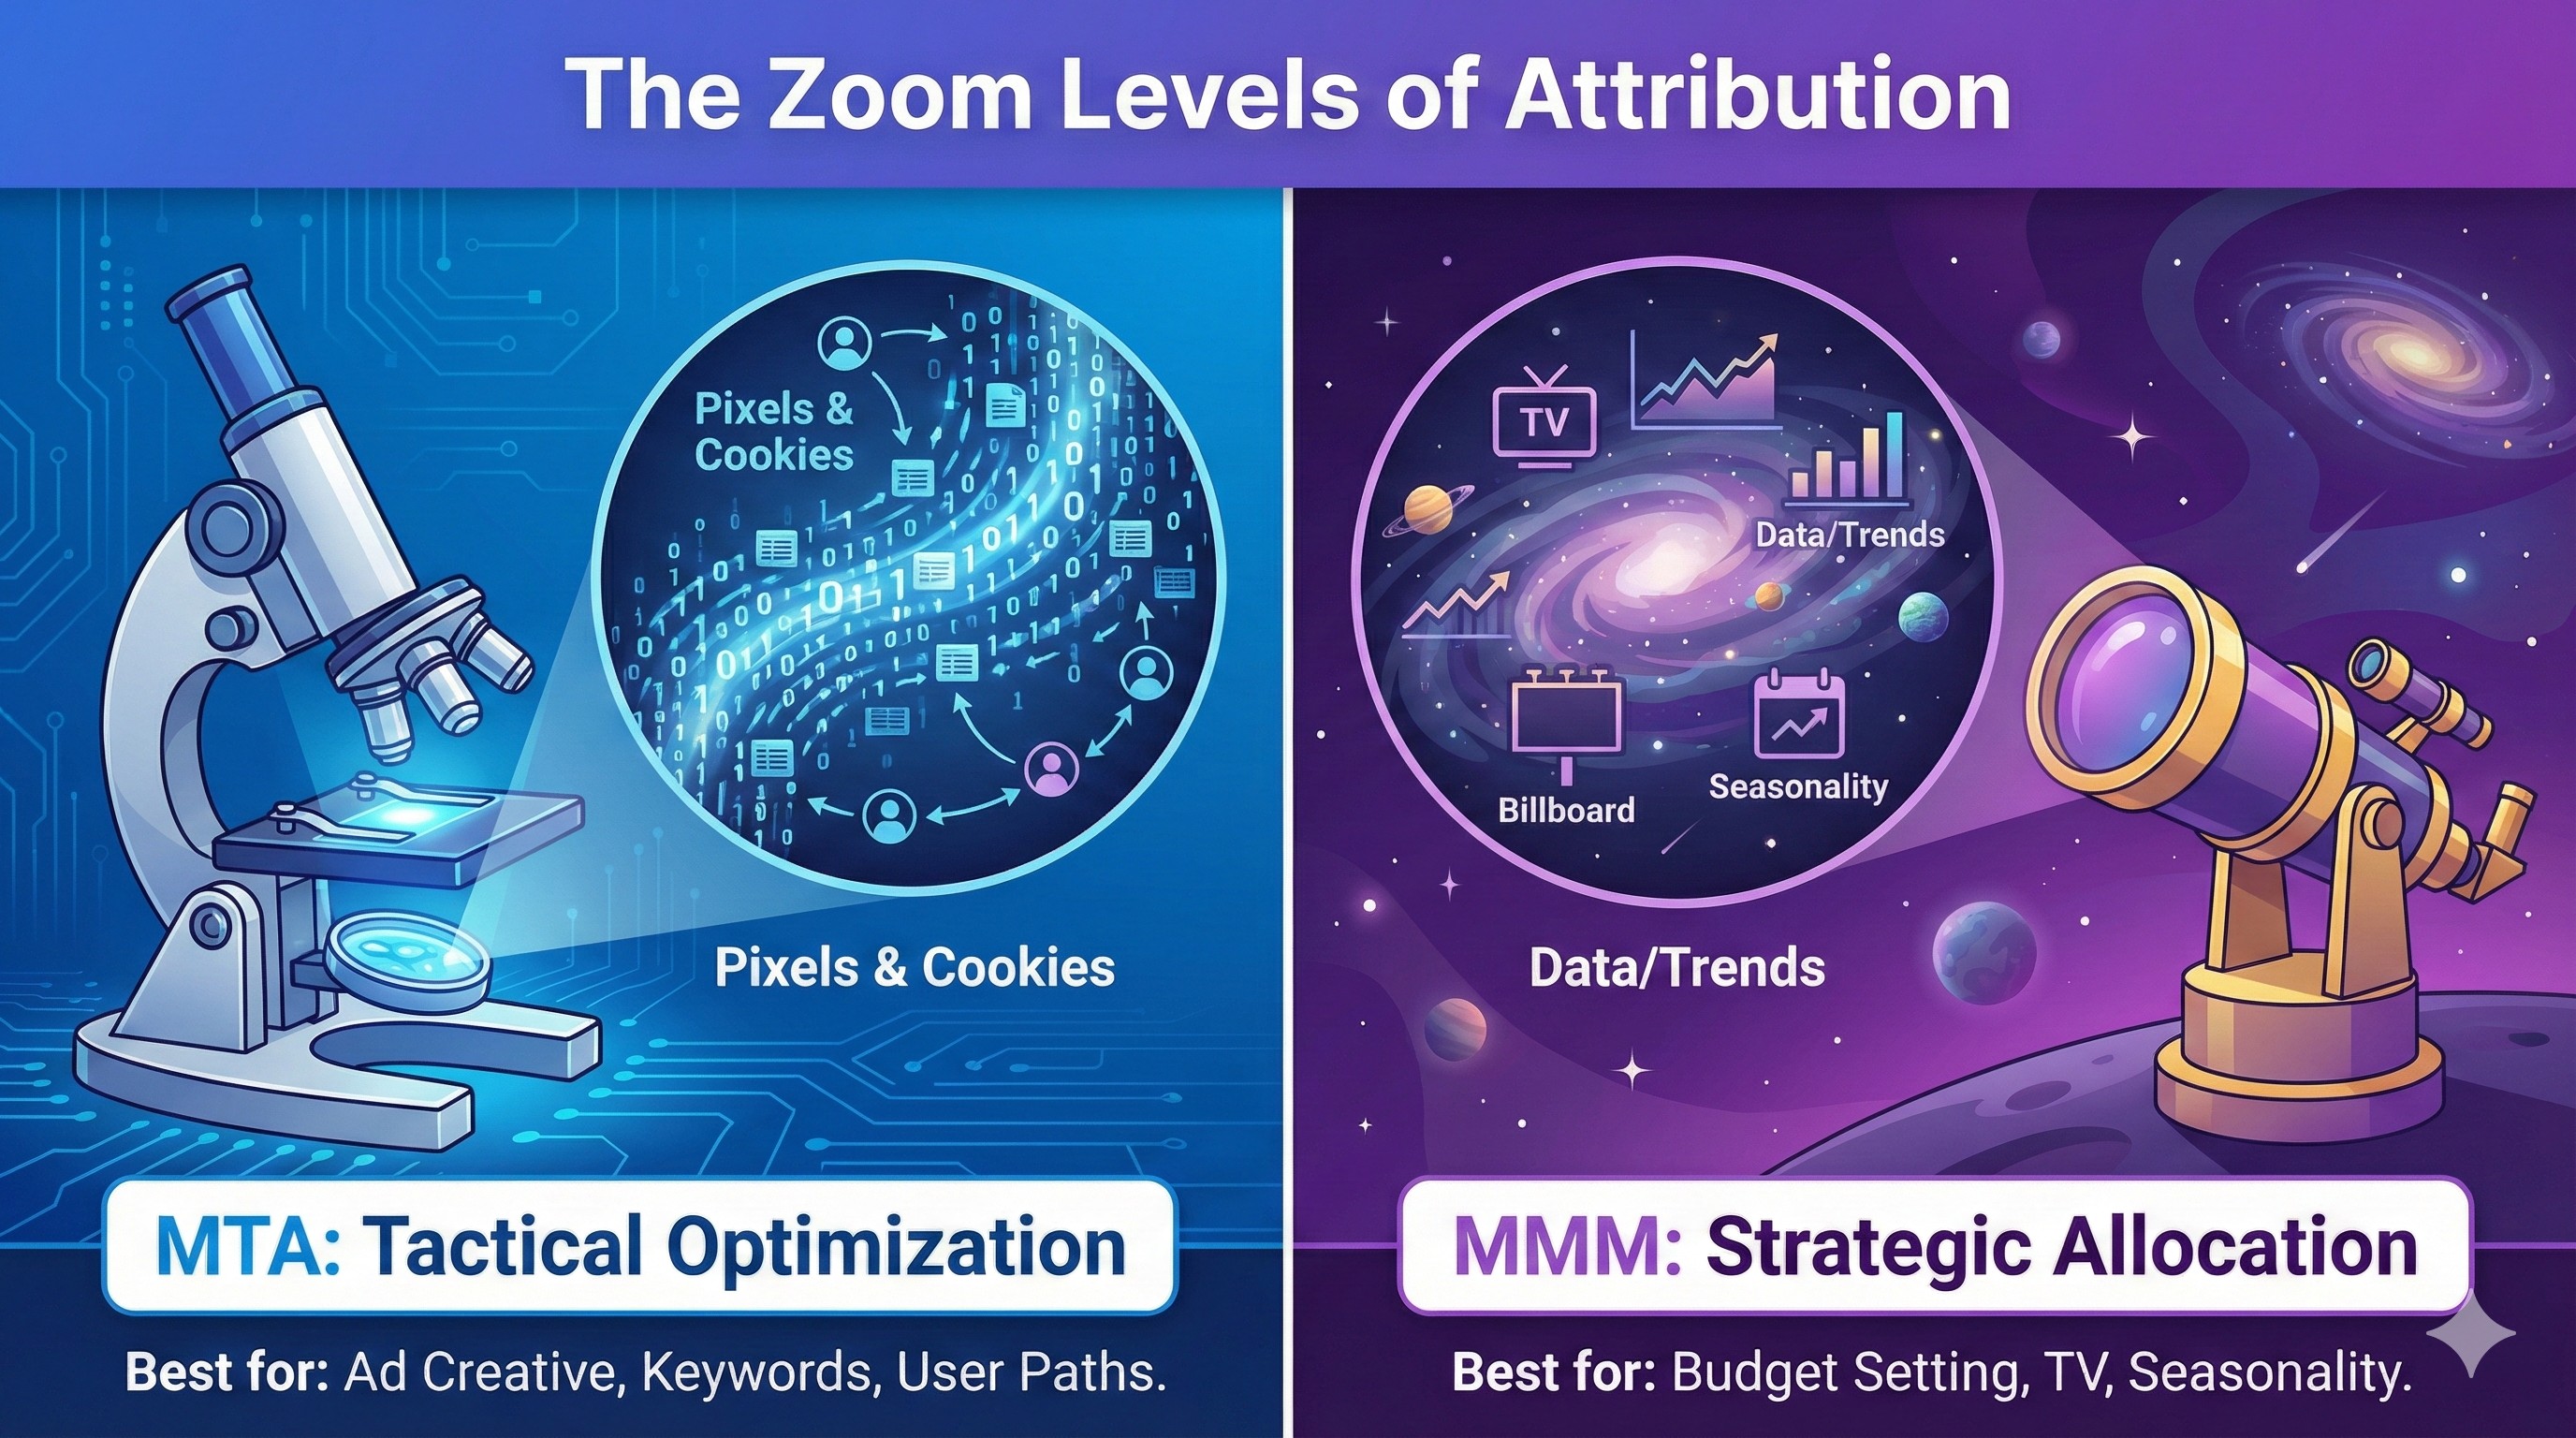
"Asking 'MTA or MMM?'" I said, "is like asking a scientist, 'Do you want a Microscope or a Telescope?'"
"If you want to study bacteria (Facebook Creative), you need a Microscope. If you want to study galaxies (TV Campaigns), you need a Telescope. If you try to look at the stars with a microscope, you’re going to be very confused."
The answer isn't "Or." It's "And." But you have to know when to use which.
2. The Concept (Triangulation)
Here is what I tell my clients: Use MMM to set the Budget. Use MTA to spend it.
We call this Triangulation.
Please ensure the file is named exactly:
blog 10.1.jpg
MTA (The Microscope): This is Tactical. It zooms in.
Question: "Should I swap the headline on this Google Search Ad?"
Data: User-level, fast (Real-time), requires cookies.
Blind Spot: Cannot see Offline, Word of Mouth, or Brand Halo.
MMM (The Telescope): This is Strategic. It zooms out.
Question: "Should I move $1 Million from Facebook to TV next quarter?"
Data: Aggregate-level, slow (Monthly/Quarterly), privacy-safe (No cookies).
Blind Spot: Cannot tell you which specific ad creative worked.
The Comparison Matrix
3. The Strategic Solution (The Decision Matrix)
"Okay," the CEO said. "But I only have $50k right now. I have to pick one to start."
"Here is the checklist I use," I replied. "Find where Ujvi fits."
The Attribution Decision Matrix
Scenario A: The Digital Native
Profile: You spend 90% of your budget on Meta, Google, and TikTok. You sell D2C.
Verdict: Start with MTA. You need to optimize creative daily. MMM is too slow for you right now.
Scenario B: The Omni-Channel Brand
Profile: You spend >30% on TV, Billboards, or Radio. You sell in Retail stores (Target/Walmart).
Verdict: Start with MMM. MTA is useless for Retail sales. You will be flying blind on 30% of your spend without MMM.
Scenario C: The Impulse Buy
Profile: You sell $20 candles. Sales cycle is < 7 days.
Verdict: MTA is great. The "Lookback Window" captures most of the value.
Scenario D: The Considered Purchase
Profile: You sell $40,000 cars or Enterprise SaaS. Sales cycle is 6 months.
Verdict: MMM + Multi-Touch. Cookies expire in 30 days. You need MMM to capture the long-term brand equity you built 5 months ago.
"Ujvi is shifting to TV next year," the CEO noted. "So we need the Telescope."
4. The Real Scenario (Ujvi's Hybrid Model)
To prove why this matters, let's simulate what would happen if Ujvi ran a Super Bowl Ad without the right tool.
Python: Super Bowl Simulationimport pandas as pd
import numpy as np
# Create timestamps for Super Bowl Sunday (6 PM to 10 PM)
timestamps = pd.date_range(start='2026-02-08 18:00:00', end='2026-02-08 22:00:00', freq='10T')
df_sb = pd.DataFrame({'Time': timestamps})
# Simulate TV Spend (Spike at 8:00 PM)
df_sb['TV_Spend'] = 0
df_sb.loc[df_sb['Time'].dt.hour == 20, 'TV_Spend'] = [50000, 0, 0, 0, 0, 0] # Spike at 20:00 only
# Simulate Lagged Response (Direct Traffic spikes 10 mins later)
df_sb['Direct_Traffic'] = 100 # Baseline
df_sb.loc[df_sb['Time'].dt.hour == 20, 'Direct_Traffic'] = [100, 5000, 4000, 2000, 1000, 500]
# Simulate Sales (Spikes 10-20 mins later)
df_sb['Sales'] = 10 # Baseline
df_sb.loc[df_sb['Time'].dt.hour == 20, 'Sales'] = [10, 50, 500, 400, 200, 100]
# Calculate Correlations
corr_mta = df_sb['Direct_Traffic'].corr(df_sb['Sales'])
corr_mmm = df_sb['TV_Spend'].shift(2).fillna(0).corr(df_sb['Sales']) # 20 min lag
print("Super Bowl Scenario Data Head:")
print(df_sb[df_sb['Time'].dt.hour == 20])
print(f"\nMTA View (Direct <-> Sales Correlation): {corr_mta:.4f}")
print(f"MMM View (TV <-> Sales Correlation w/ Lag): {corr_mmm:.4f}")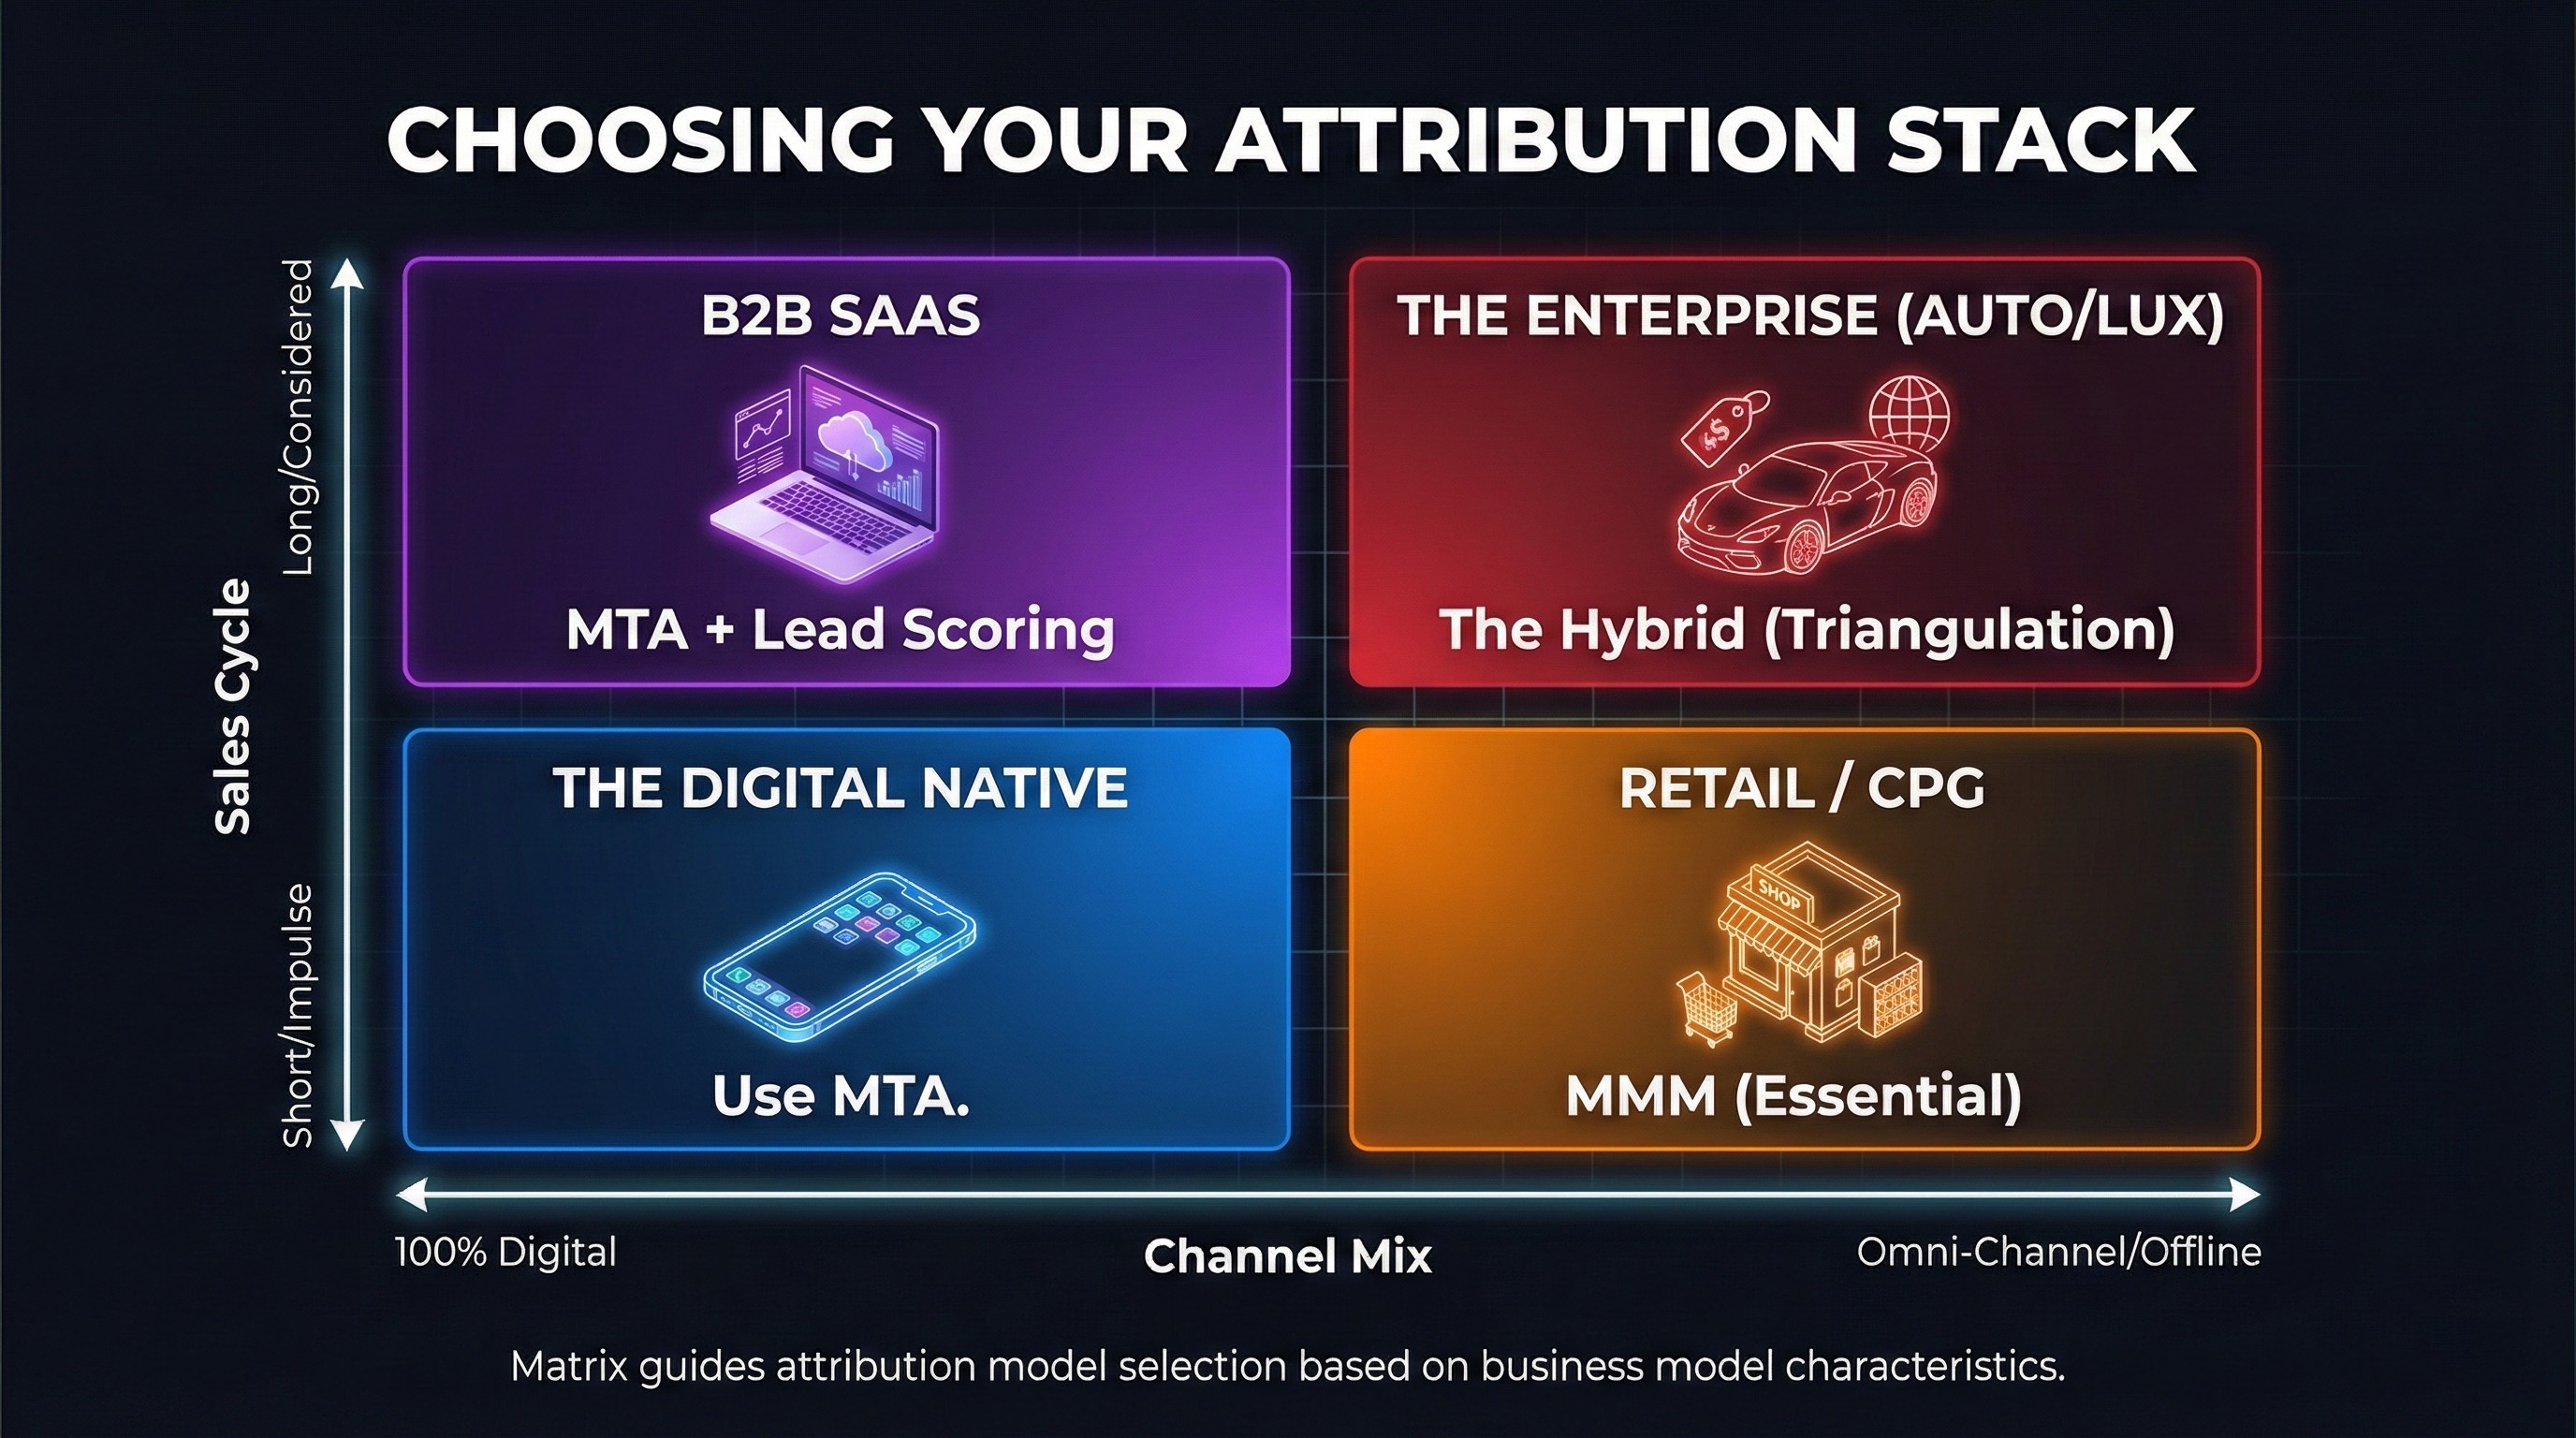
Please ensure the file is named exactly:
blog 10.2.jpg
The Setup:
It's Super Bowl Sunday.
- 8:00 PM: Ujvi airs a $50,000 TV Commercial.
- 8:10 PM: 5,000 people pick up their phones and search "Ujvi Candles."
- 8:15 PM: Sales spike by 500%.
The MTA View (The Error):
MTA looks at the "Click Path."
It sees 5,000 clicks from Google Search and Direct.
It sees 0 clicks from TV (obviously).
Conclusion: "Wow! Google Search is on fire tonight! Cancel the TV ads and double the Google budget!"
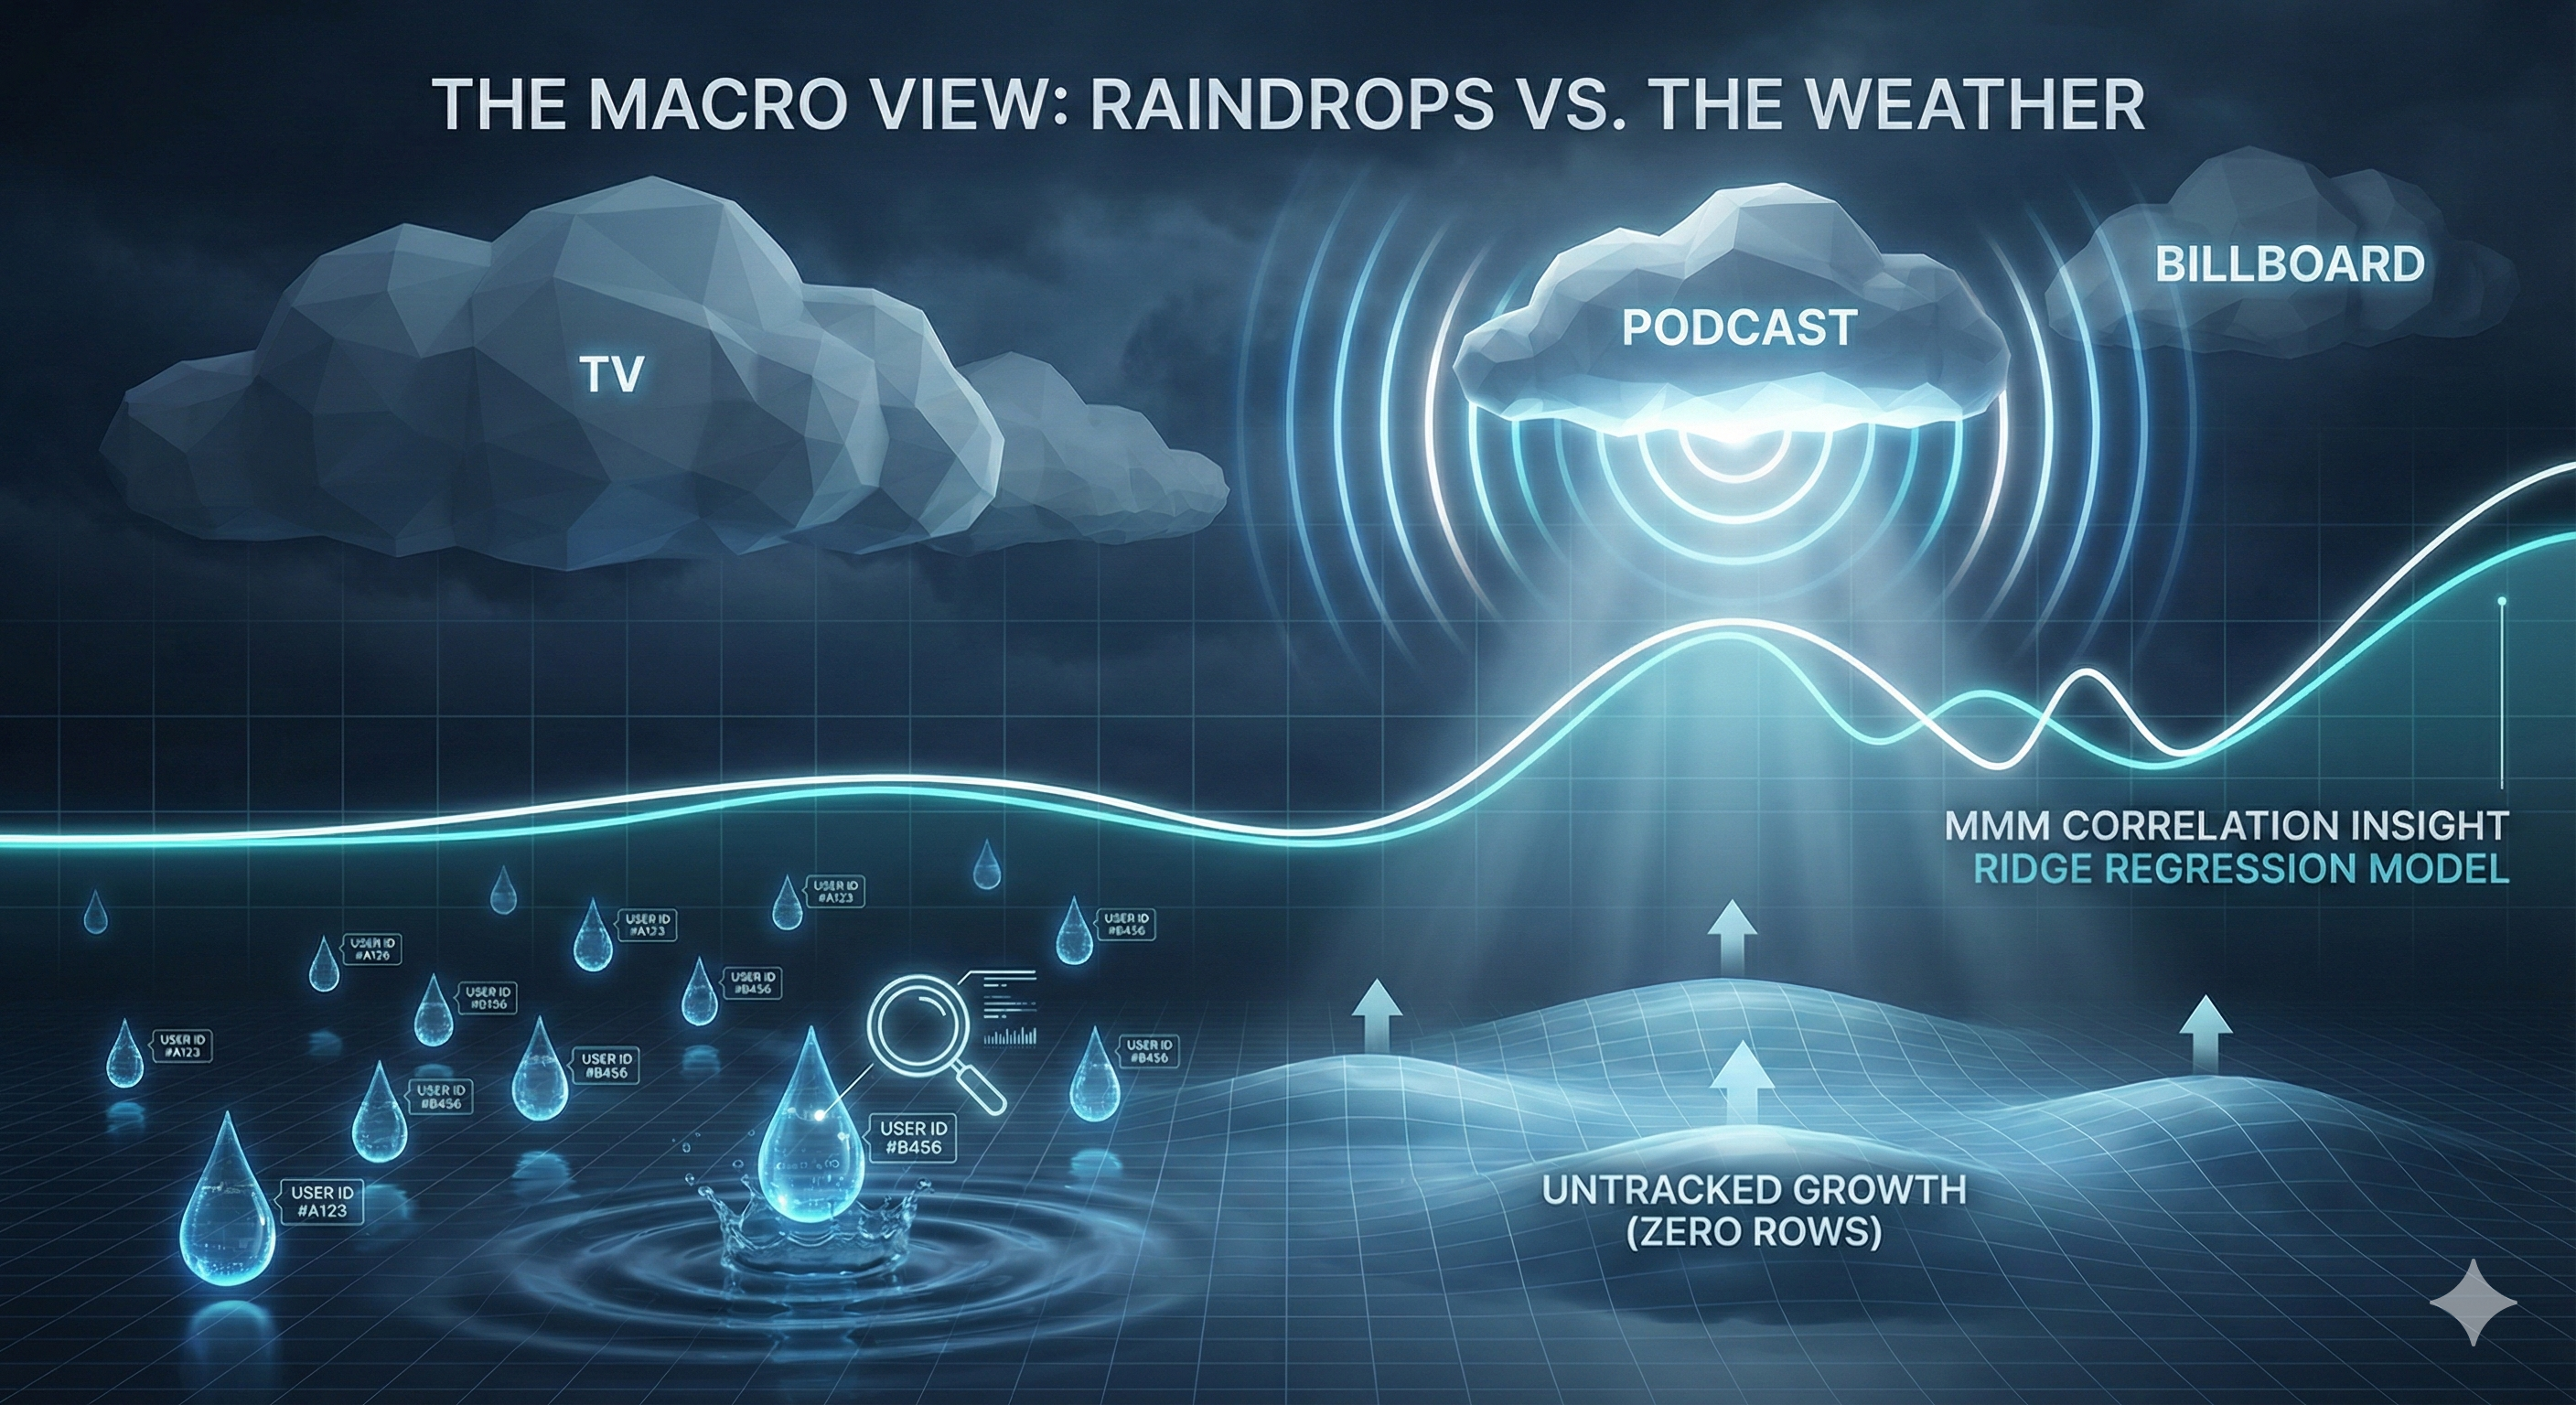
The MMM View (The Truth):
MMM looks at the "Time Series."
It sees a spike in Spend (TV) at 8:00 PM.
It sees a spike in Sales at 8:15 PM.
Conclusion: "The TV spend caused the sales. Google was just the net that caught the fish."
The Consequence:
If Ujvi listened to the Microscope (MTA), they would cut the very thing (TV) that was driving the sales. They would double down on the net (Google) but stop feeding the fish.
5. The Reality Check
"So the answer is... do both?" the Brand Director asked.
"Eventually," I said. "But there is a cost."
Running a robust MTA tool (like Northbeam, Triple Whale, or a custom SQL build) costs money and engineering time. Running a robust MMM (like Recast, Nielsen, or a custom Python build) costs money and data science time.
My Advice for Ujvi:
- Phase 1 (Today): Stick with MTA. You are mostly digital. Optimize your ads.
- Phase 2 ($1M+ Spend): Once you launch TV, build a simple MMM (like the one we built in Module 9) to check your "Baseline."
- Phase 3 (Triangulation): Use MMM to tell you how much to spend. Use MTA to tell you where to spend it.
6. Next Steps & Interaction
We have built the database, cleaned the logs, modeled the journeys, and even zoomed out to the macro view. Ujvi Candles now has a sophisticated Attribution Engine.
But knowing what happened is only half the battle. The final step is turning that knowledge into profit. We need to talk about ROI.
In the final post of this series, we stop being Data Scientists and start being CFOs. We talk about Budget Optimization.
Over to you: Does your company use "Microscopes" (MTA), "Telescopes" (MMM), or are you flying blind? Tell me your stack in the comments.