Predictive Marketing Attribution (and the "Survivorship Bias" Trap)
1. The Hook
I was standing in front of the whiteboard at Ujvi Candles, holding a red marker. The CEO was beaming. He loved the Markov Chain model we built last week. He loved seeing the "network map" of his marketing channels.
"This is it," he said. "We finally know exactly how people buy."
"No," I said, uncapping the marker. "We know exactly how buyers buy."
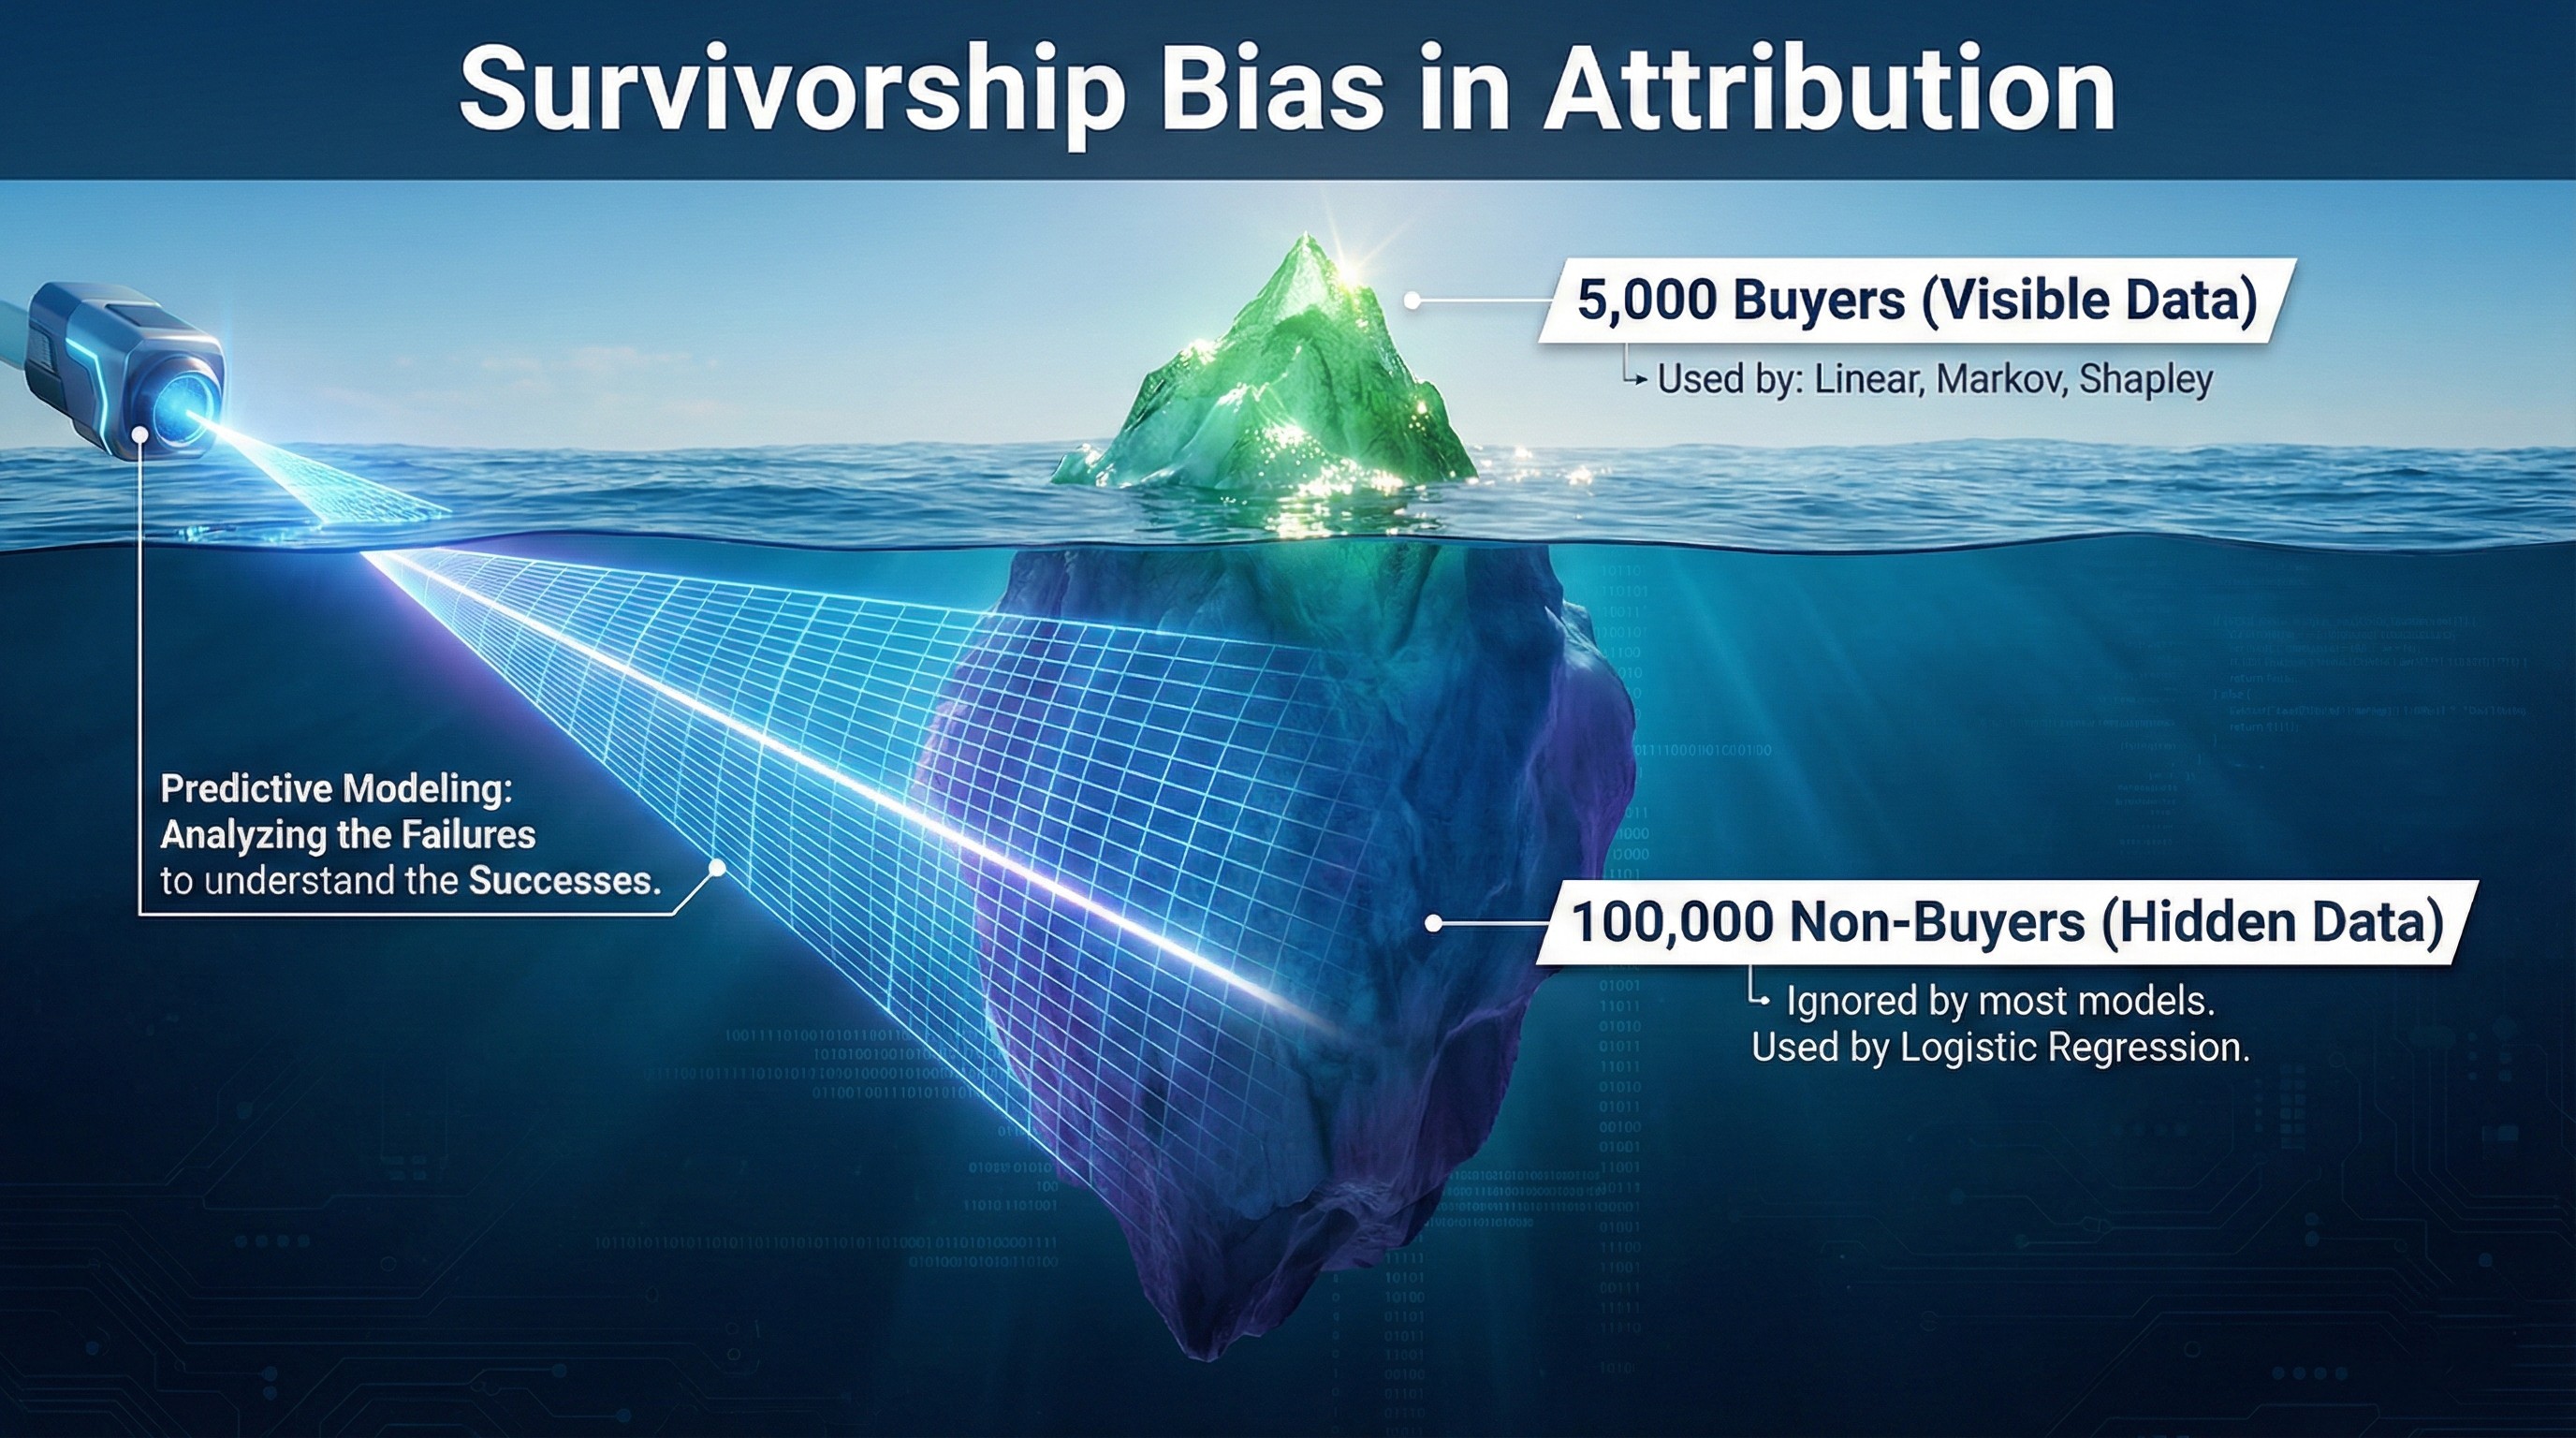
I drew a big circle on the board and wrote 5,000 inside it. "These are the people who bought candles last month. Our Markov model studies them perfectly."
Then I drew a massive, menacing circle around it and wrote 100,000.
"These," I said, pointing to the outer ring, "are the people who visited your site and left. They bounced. They abandoned carts. They hated the price. They got annoyed by the popup."
The room went quiet.
"We have spent eight weeks analyzing the winners," I continued. "But we have completely ignored the losers. We are suffering from Survivorship Bias."
It’s the classic World War II airplane problem. You don't reinforce the parts of the plane where the returning bombers have bullet holes. You reinforce the parts where the missing planes were hit.
To truly fix Ujvi’s marketing, we need to stop asking "What did the buyers do?" and start asking "What did the buyers do that the non-buyers didn't?"
We need Predictive Attribution.
2. The Concept (The Medical Study)
Here is what I tell my clients: Stop thinking like an Accountant. Start thinking like a Doctor.
Please ensure the file is named exactly:
blog 8.1.jpg
Imagine a medical study for a new drug.
- Group A (The Survivors): 100 people took the drug and got better.
Conclusion: The drug is a miracle!
But wait. What if I told you there was a Group B?
- Group B (The Non-Survivors): 1,000 people took the drug and didn't get better.
Suddenly, that miracle drug looks like snake oil.
In Marketing Attribution, previous models (Linear, Shapley, Markov) only look at Group A. They split the credit among the channels present in successful conversions.
Logistic Regression looks at both groups. It compares the Successes (1) against the Failures (0).
It asks: "Does the presence of TikTok increase the probability of a 1?"
If TikTok appears in 50% of sales but 90% of bounces, the model realizes: TikTok is actually hurting us.
3. The Technical Solution (Python Logic)
"We need to build a training set," I told the data team. "We need to mix the Gold (Transactions) with the Dirt (Bounces)."
To do this, we need Python and scikit-learn. We are going to build a Logistic Regression model.
The Math:
We aren't predicting a number (like Revenue). We are predicting a State (0 or 1).
The formula isn't \(y = mx + b\). It's the Sigmoid Function:
$$P(Conversion) = \frac{1}{1 + e^{-(b_0 + b_1X_1 + b_2X_2...)}}$$
Don't panic. All that matters are the Coefficients ($b$).
- Positive Coefficient: This channel increases the odds of buying. (The Hero).
- Negative Coefficient: This channel decreases the odds of buying. (The Conversion Killer).
The Code:
Python: Logistic Regressionimport pandas as pd
from sklearn.linear_model import LogisticRegression
import numpy as np
# 1. THE SETUP
# We combine our Orders (1) with a sample of Non-Orders (0)
# (Note: In real life, you'd pull this from GA4 BigQuery export)
data = pd.DataFrame({
'User_ID': [1, 2, 3, 4, 5],
'Saw_Facebook': [1, 1, 0, 1, 0],
'Saw_Email': [0, 1, 1, 0, 0],
'Saw_SEO': [1, 1, 1, 1, 1],
'CONVERTED': [0, 1, 1, 0, 0] # The Target (y)
})
# 2. THE SPLIT
X = data[['Saw_Facebook', 'Saw_Email', 'Saw_SEO']] # Features
y = data['CONVERTED'] # Target
# 3. THE MODEL
model = LogisticRegression(fit_intercept=True)
model.fit(X, y)
# 4. THE REVEAL (The Coefficients)
feature_names = X.columns
coefficients = model.coef_[0]
for name, coef in zip(feature_names, coefficients):
# Convert Log-Odds to "Multiplier" (Odds Ratio)
impact = np.exp(coef)
print(f"{name}: {impact:.2f}x likelihood to buy")4. The Real Data Scenario
We looked at Order #19387723 again.
The Journey:
SEO > Direct > Direct > PPC > Direct > Organic Social > Direct ... > Purchase
In Module 06 (Markov), we praised Organic Social. It was the "Hub." It appeared in the middle of the chain, bridging the gap between Direct visits. Markov gave it high credit because removing it broke the path.
The "Predictive" Twist:
Now, imagine we feed this into the Logistic Regression model along with 10,000 non-converting users.
The model analyzes the data and finds a disturbing pattern:
- Users who see SEO: 5% Conversion Rate.
- Users who see PPC: 8% Conversion Rate.
- Users who see Organic Social: 1% Conversion Rate.
Wait. Why?
It turns out, while User #19387723 eventually bought, most people who get stuck in that Social <-> Direct loop never buy. They are "Window Shoppers." They like the aesthetic of the candles on Instagram, but they never pull the trigger.
User #19387723 was an outlier—a Survivor.
Please ensure the file is named exactly:
blog 8.2.jpg
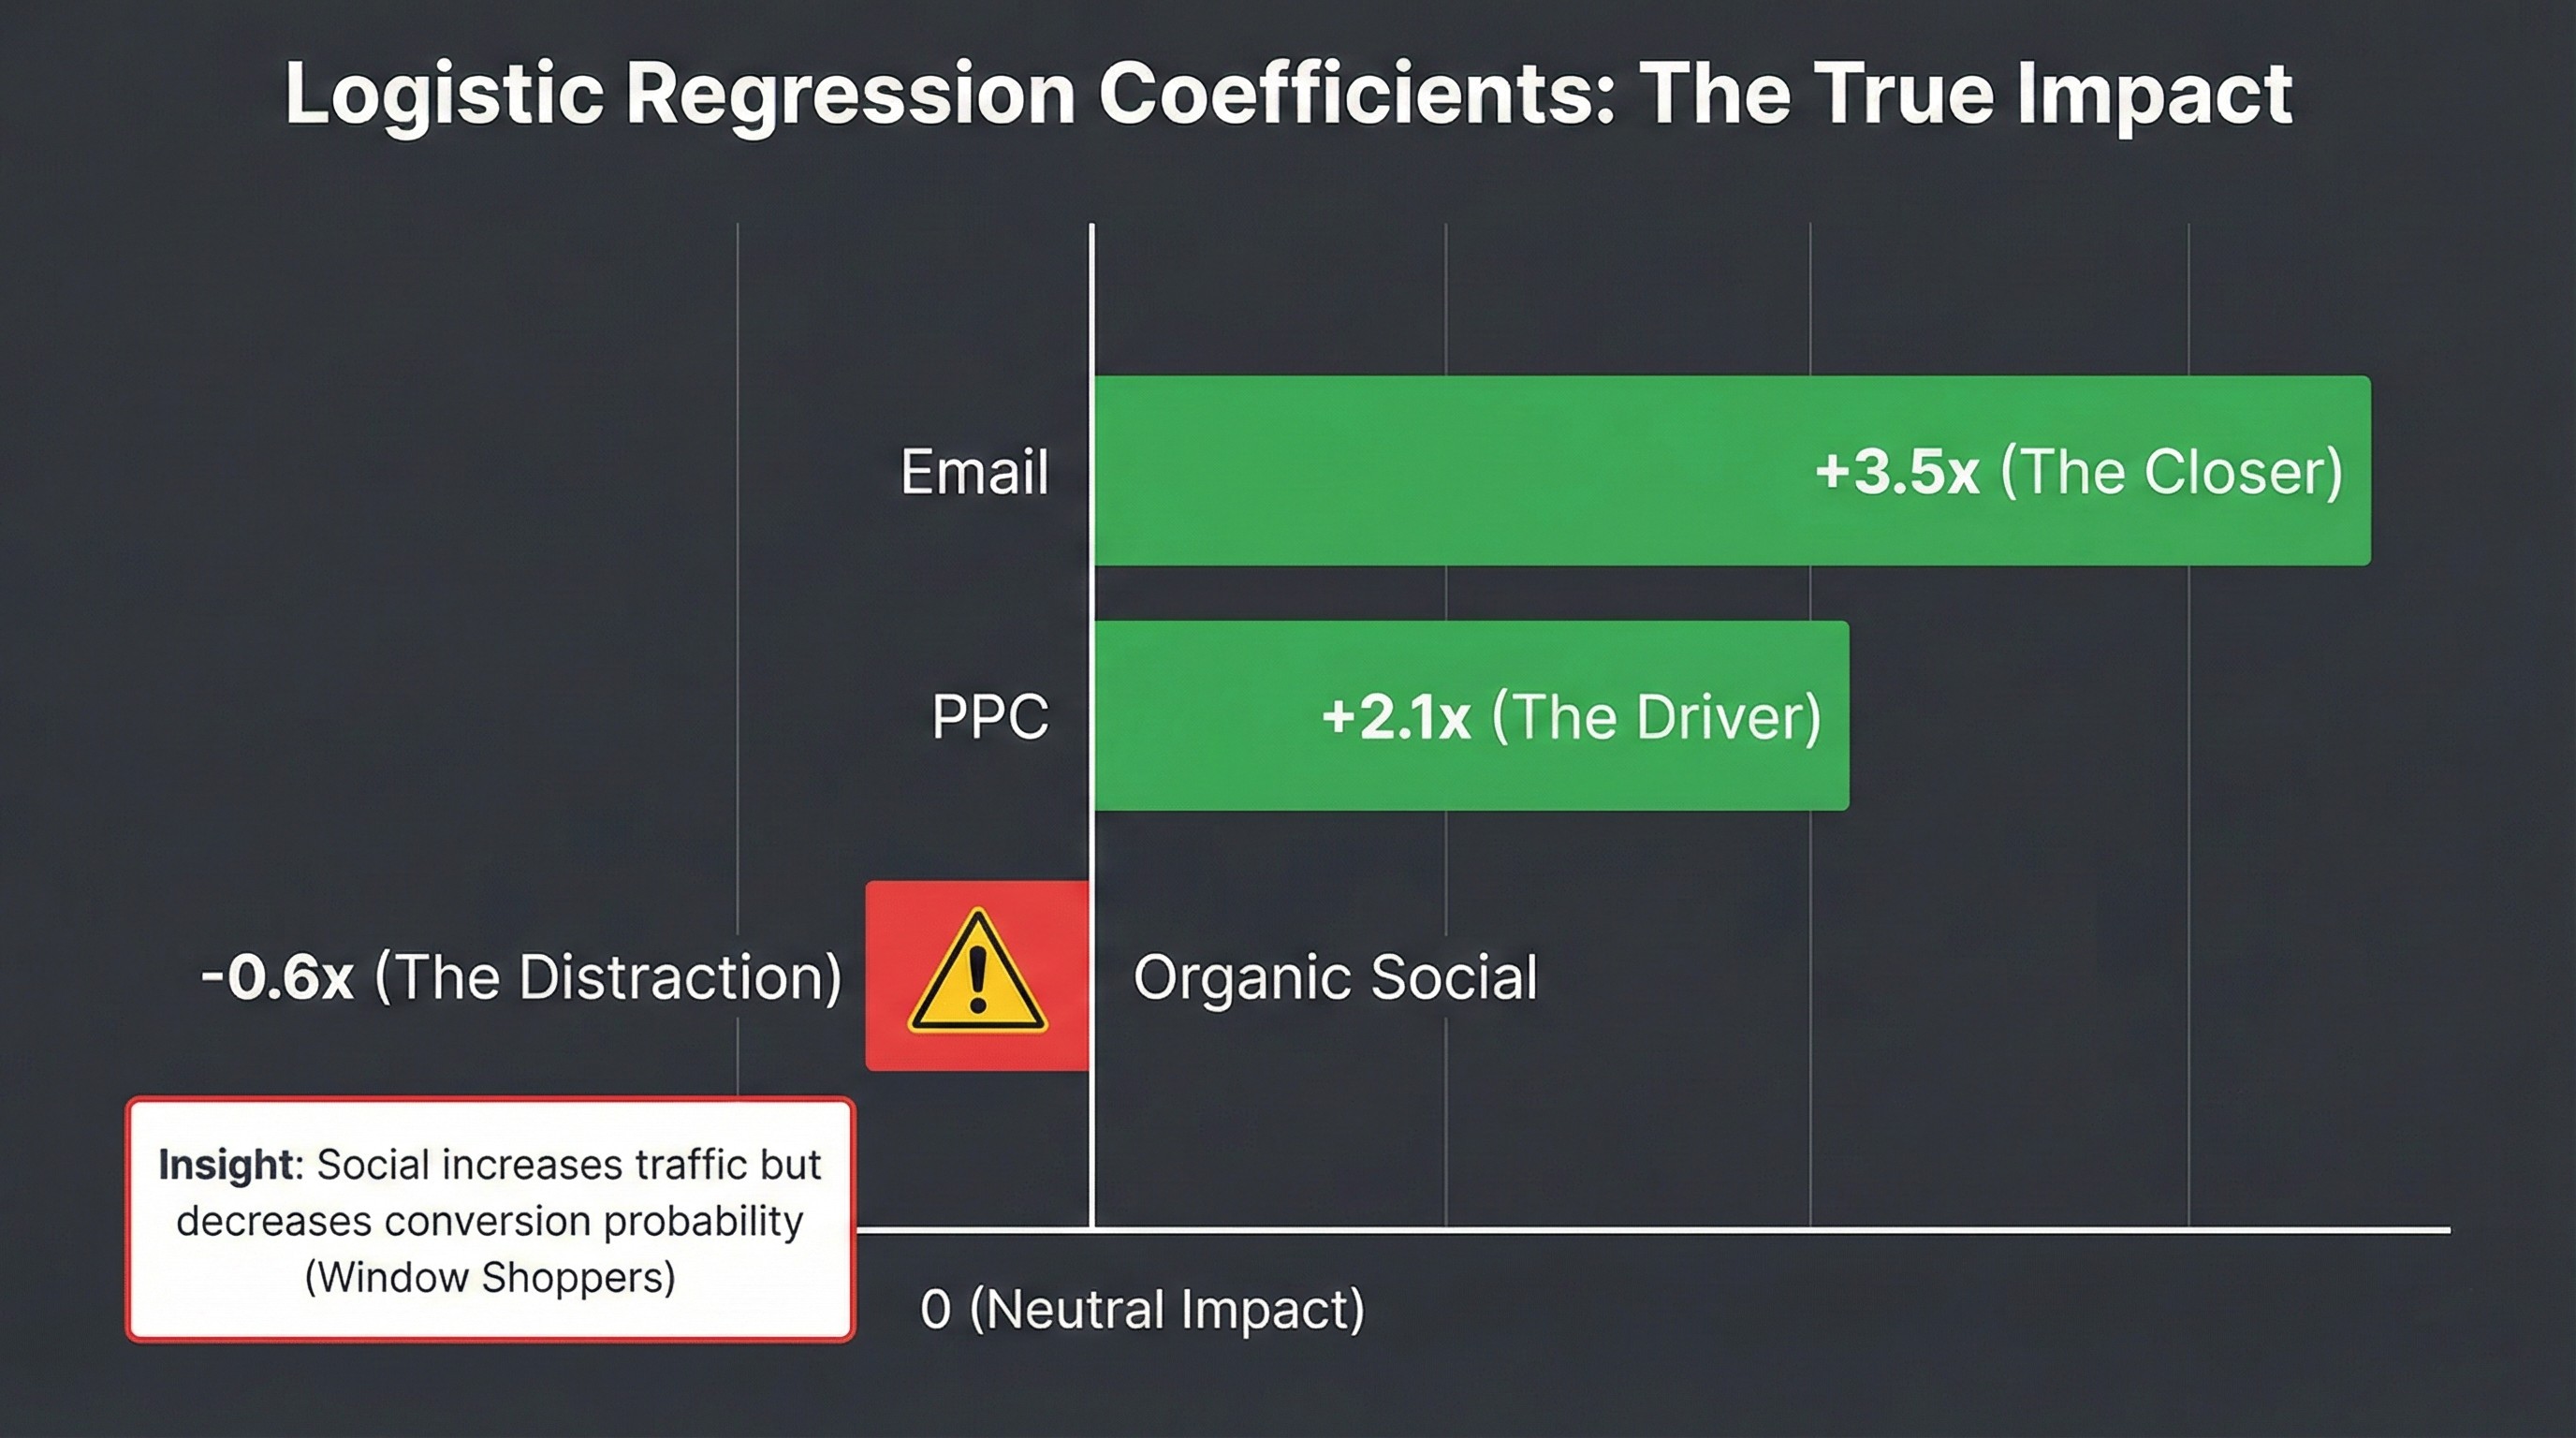
The Model's Verdict: Feature Importance (Odds of Conversion)
The Insight:
The Logistic Regression model assigns a Negative Coefficient to Organic Social.
This implies that, statistically speaking, a user who interacts with Organic Social is less likely to buy than a baseline user who doesn't.
Markov said Social was Essential.
Logistic Regression says Social is Inefficient.
Who is right?
Markov is right about the Structure (Social keeps them engaged).
Logistic is right about the Outcome (Engagement $\neq$ Money).
5. The Reality Check
Ujvi's CEO looked at the "Conversion Killer" chart. "So I should fire my Social Media Manager?"
"No," I said. "You should change her KPIs."
This model reveals that Social isn't a sales driver; it's a branding tool. If you judge a fish by its ability to climb a tree (drive immediate conversions), it will fail this model.
Pros of Predictive Attribution:
- Truth: It uses all the data, not just the happy paths.
- Weights: It gives you a mathematical multiplier for every channel.
- Prediction: You can calculate the "Propensity to Buy" for a user who has only done 2 steps so far.
Cons of Predictive Attribution:
- Data Heavy: You need to store and process millions of "Non-Conversion" rows.
- Correlation $\neq$ Causation: Just because Display Ads are correlated with non-buyers doesn't mean the ads caused them not to buy. It might just mean that cheap traffic clicks on Display Ads.
6. Next Steps & Interaction
We have now built the ultimate micro-view. We have traced individual user paths, modeled their graph, and calculated their probability.
But there is one thing we haven't touched.
The Offline World.
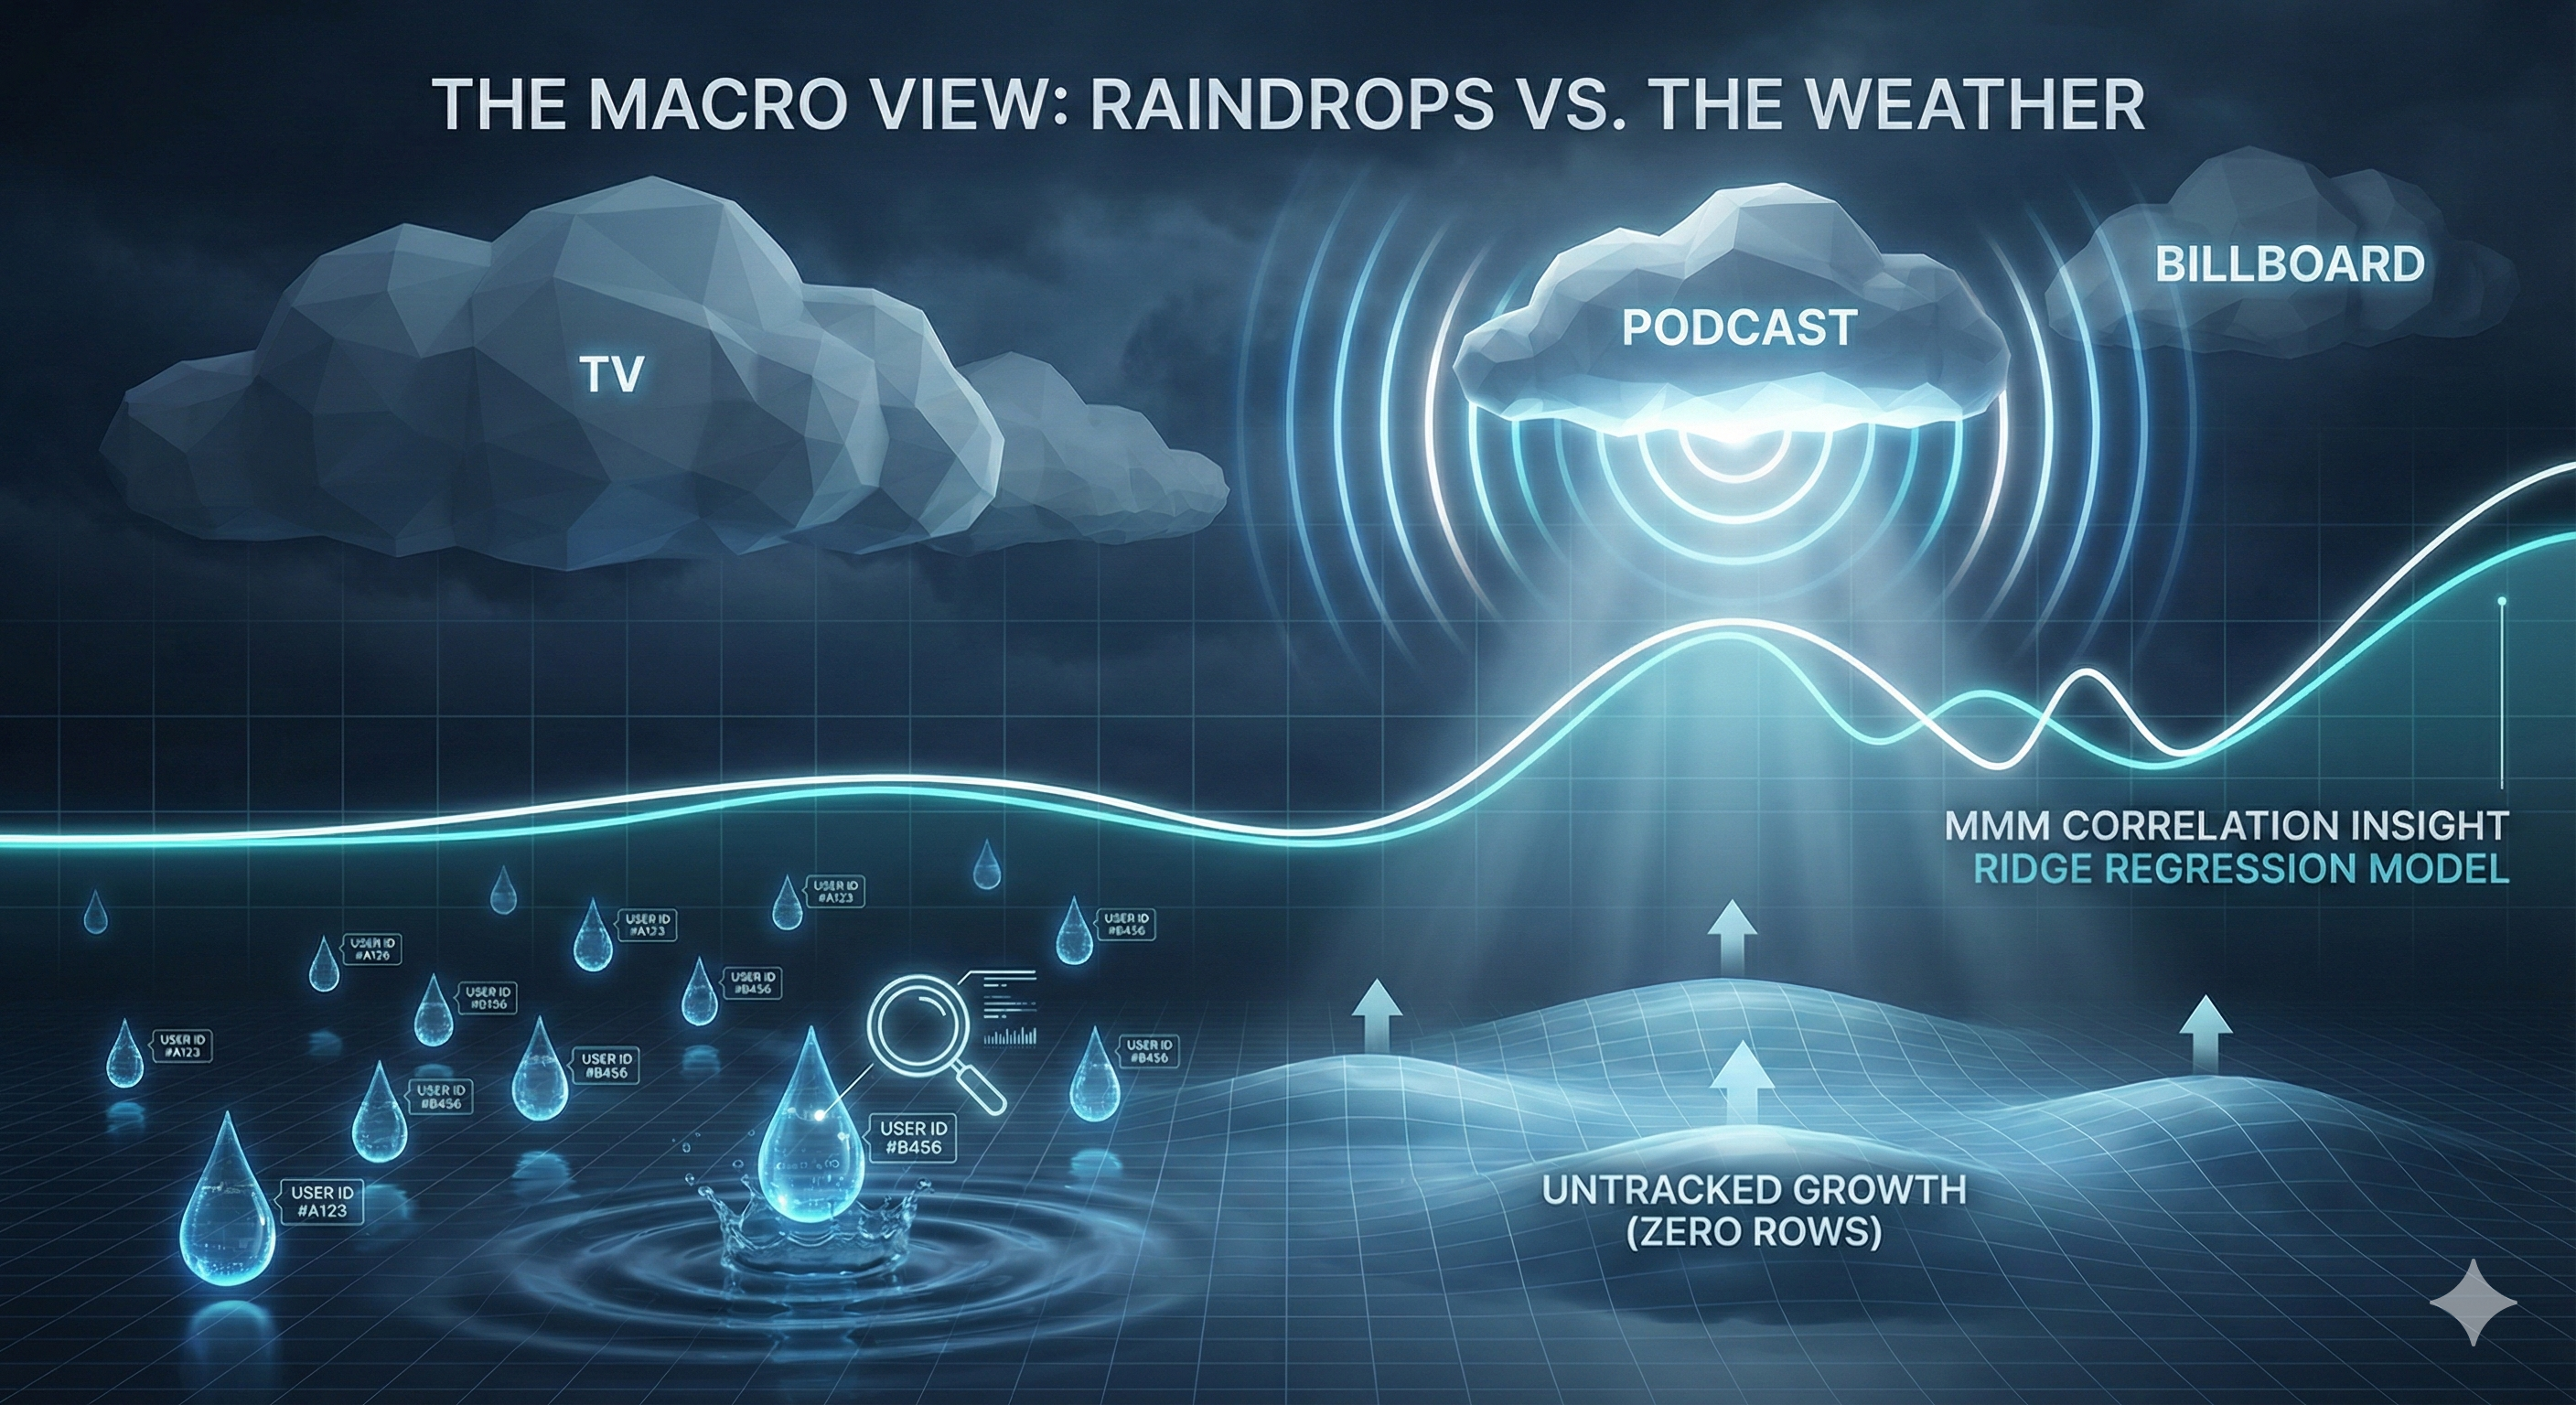
What about the TV ad? What about the Billboard? What about the fact that it’s Christmas?
We can't track those with clicks. For that, we need to zoom out. Way out.
In the next post, we leave the User Level and enter the Macro Level. We are building Marketing Mix Modeling (MMM).
Over to you: Do you track your non-converters? Or are you suffering from Survivorship Bias? Rate your "Data Maturity" (1-10) in the comments.